Now leaving ThriventFunds.com


You're about to visit a site that is neither owned nor operated by Thrivent Asset Management.

In the interest of protecting your information, we recommend you review the privacy policies at your destination site.

Financial Professional Site Registration

Complete this form to get full access to the entire financial professional site.

By clicking “Register”, you agree to our privacy and security policies and that you are a financial professional.

Access will be granted immediately, but the registration process may take up to 5 business days to complete.

Thank you for registering

You can now enjoy all financial professional content.

If your download does not start automatically, click here.

An error occurred

Please check back later.

CAPITAL MARKETS PERSPECTIVE: AUGUST 2026

Strong economy, higher yields

08/07/2026


Key points

Economic impact

Interest rates are unlikely to rise much further or fall quickly.

Market

Investors may want to consider rotating from cash to Treasuries and/or corporate bonds.


WRITTEN BY:
Chief Investment Strategist
WRITTEN BY:
Steve Lowe, CFA,Chief Investment Strategist

Thrivent Asset Management contributors to this report: Kent White, CFA, head of fixed income mutual funds; David Spangler, CFA, vice president, model & mixed asset portfolios; and John Groton, Jr., CFA, director of administration and materials & energy research


Key points

Sustained economic growth

The U.S. economy continues to outperform expectations, driven by a large investment cycle in AI.

Stocks remain strong

Performance is broadening in more cyclical sectors, with energy and financials standout performers.

Treasuries remain attractive

Despite rising long-term yields, absolute levels are attractive and provide a compelling hedge against equity weakness.


Economy: The U.S. economy continues to outperform expectations, driven by a large investment cycle in artificial intelligence (AI). Manufacturing activity, as measured by the Institute of Supply Management, rose in July, and consumption has remained resilient. The unemployment rate remains low. July’s nonfarm payrolls fell by 23,000 jobs while downward revisions to the prior two months’ data subtracted a further 103,000 jobs. The headline Consumer Price Index (CPI) fell 0.42% in June— the largest monthly decline in six years—aided by lower oil and gasoline prices. Core CPI, which excludes food and energy costs, was flat. The Core Personal Consumption Expenditures Index (PCE) rose in June from a year ago, down from the prior month but in line with expectations.

We expect U.S. economic growth will remain robust. The ability of companies investing heavily in AI to monetize their investments and increase earnings enough to justify their rich valuations remains uncertain, while conflict in the Middle East and the path of inflation and interest rates remain risks.

Stocks: The S&P 500® Index trended down for most of July but rallied in the final days to leave the index largely unchanged on a total return basis for the month. Strength across the index continued to disperse, with energy and financials leading while information technology fell.

We expect a broadening of performance away from AI to more cyclical stocks to continue, supported by strong earnings and robust economic growth. Should equities fall significantly, we would look to add exposure to secular growth stocks at more attractive valuations, including AI leaders and beneficiaries of AI adoption.

Bonds: Longer-dated U.S. Treasuries extended their trend toward higher yields in July, with the benchmark 10-year yield rising to 4.75%. Despite more supportive inflation data, robust economic growth along with a spike in oil prices boosted expectations for sustained inflation in the months ahead. Additionally, the U.S. Federal Reserve’s (Fed) decision to keep rates unchanged sparked fears it could be behind the curve in the fight against inflation, raising concerns about long-term real rates (the yield paid after accounting for inflation). Thirty-year Treasury bond yields rose to a 19-year high and have traded above 5% for the longest number of days in a calendar year since the Global Financial Crisis. Within the corporate bond market, spreads (the yield paid over comparable Treasuries) in the technology sector widened due to the deluge of debt issuance to fund investment in AI.

We remain relatively neutral in our interest rate exposure. Longer-dated Treasuries remain attractive given their high absolute yields and their ability to act as a hedge should equity markets sell off significantly. We expect the Fed under new Chairman Kevin Warsh to establish its credibility by raising interest rates in the coming quarters.
August highlights

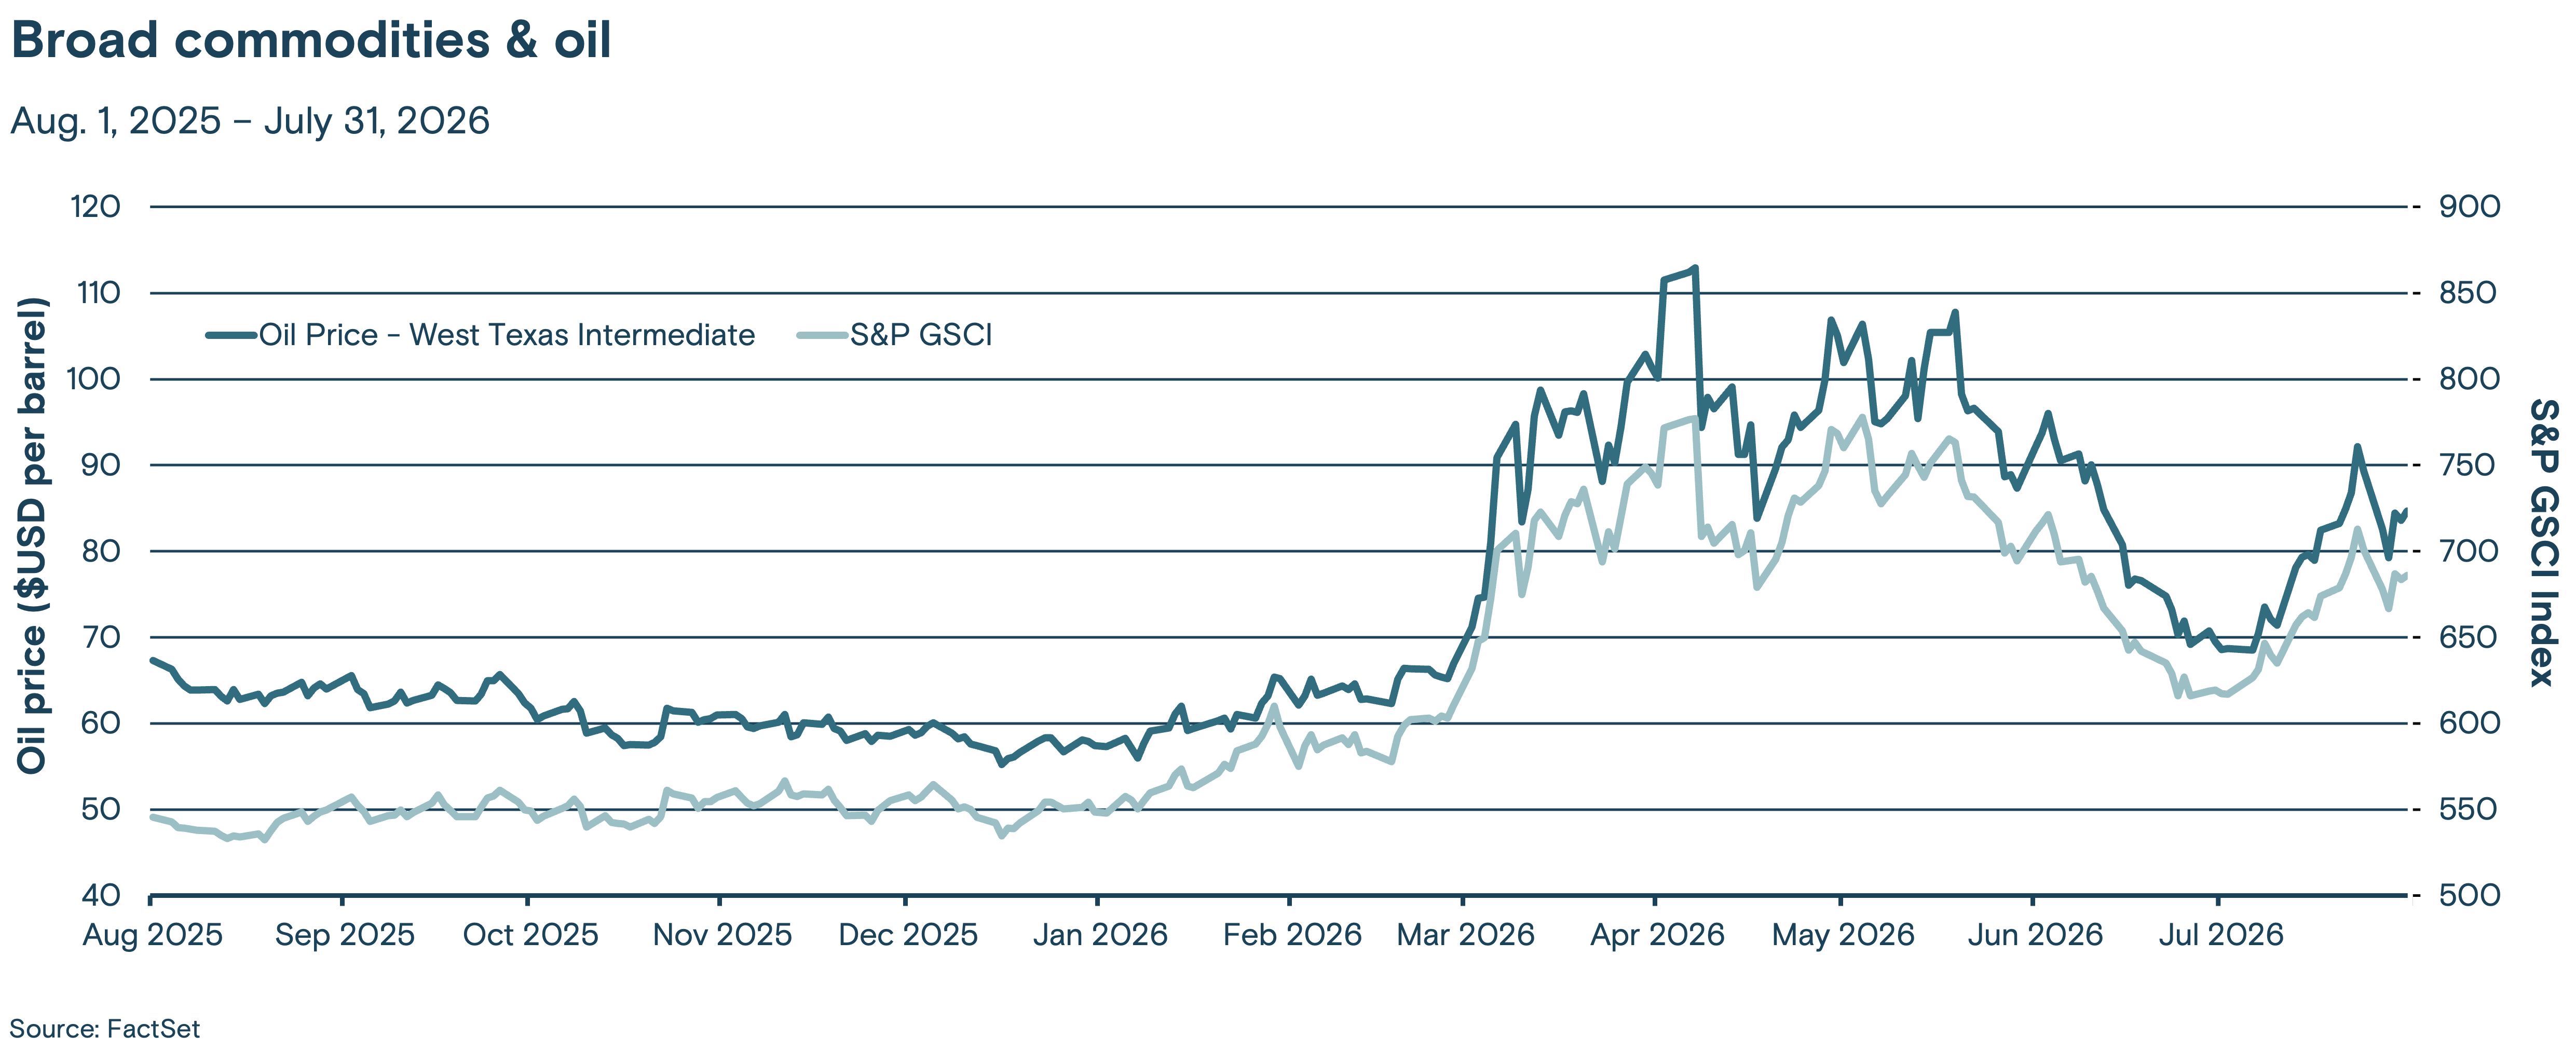
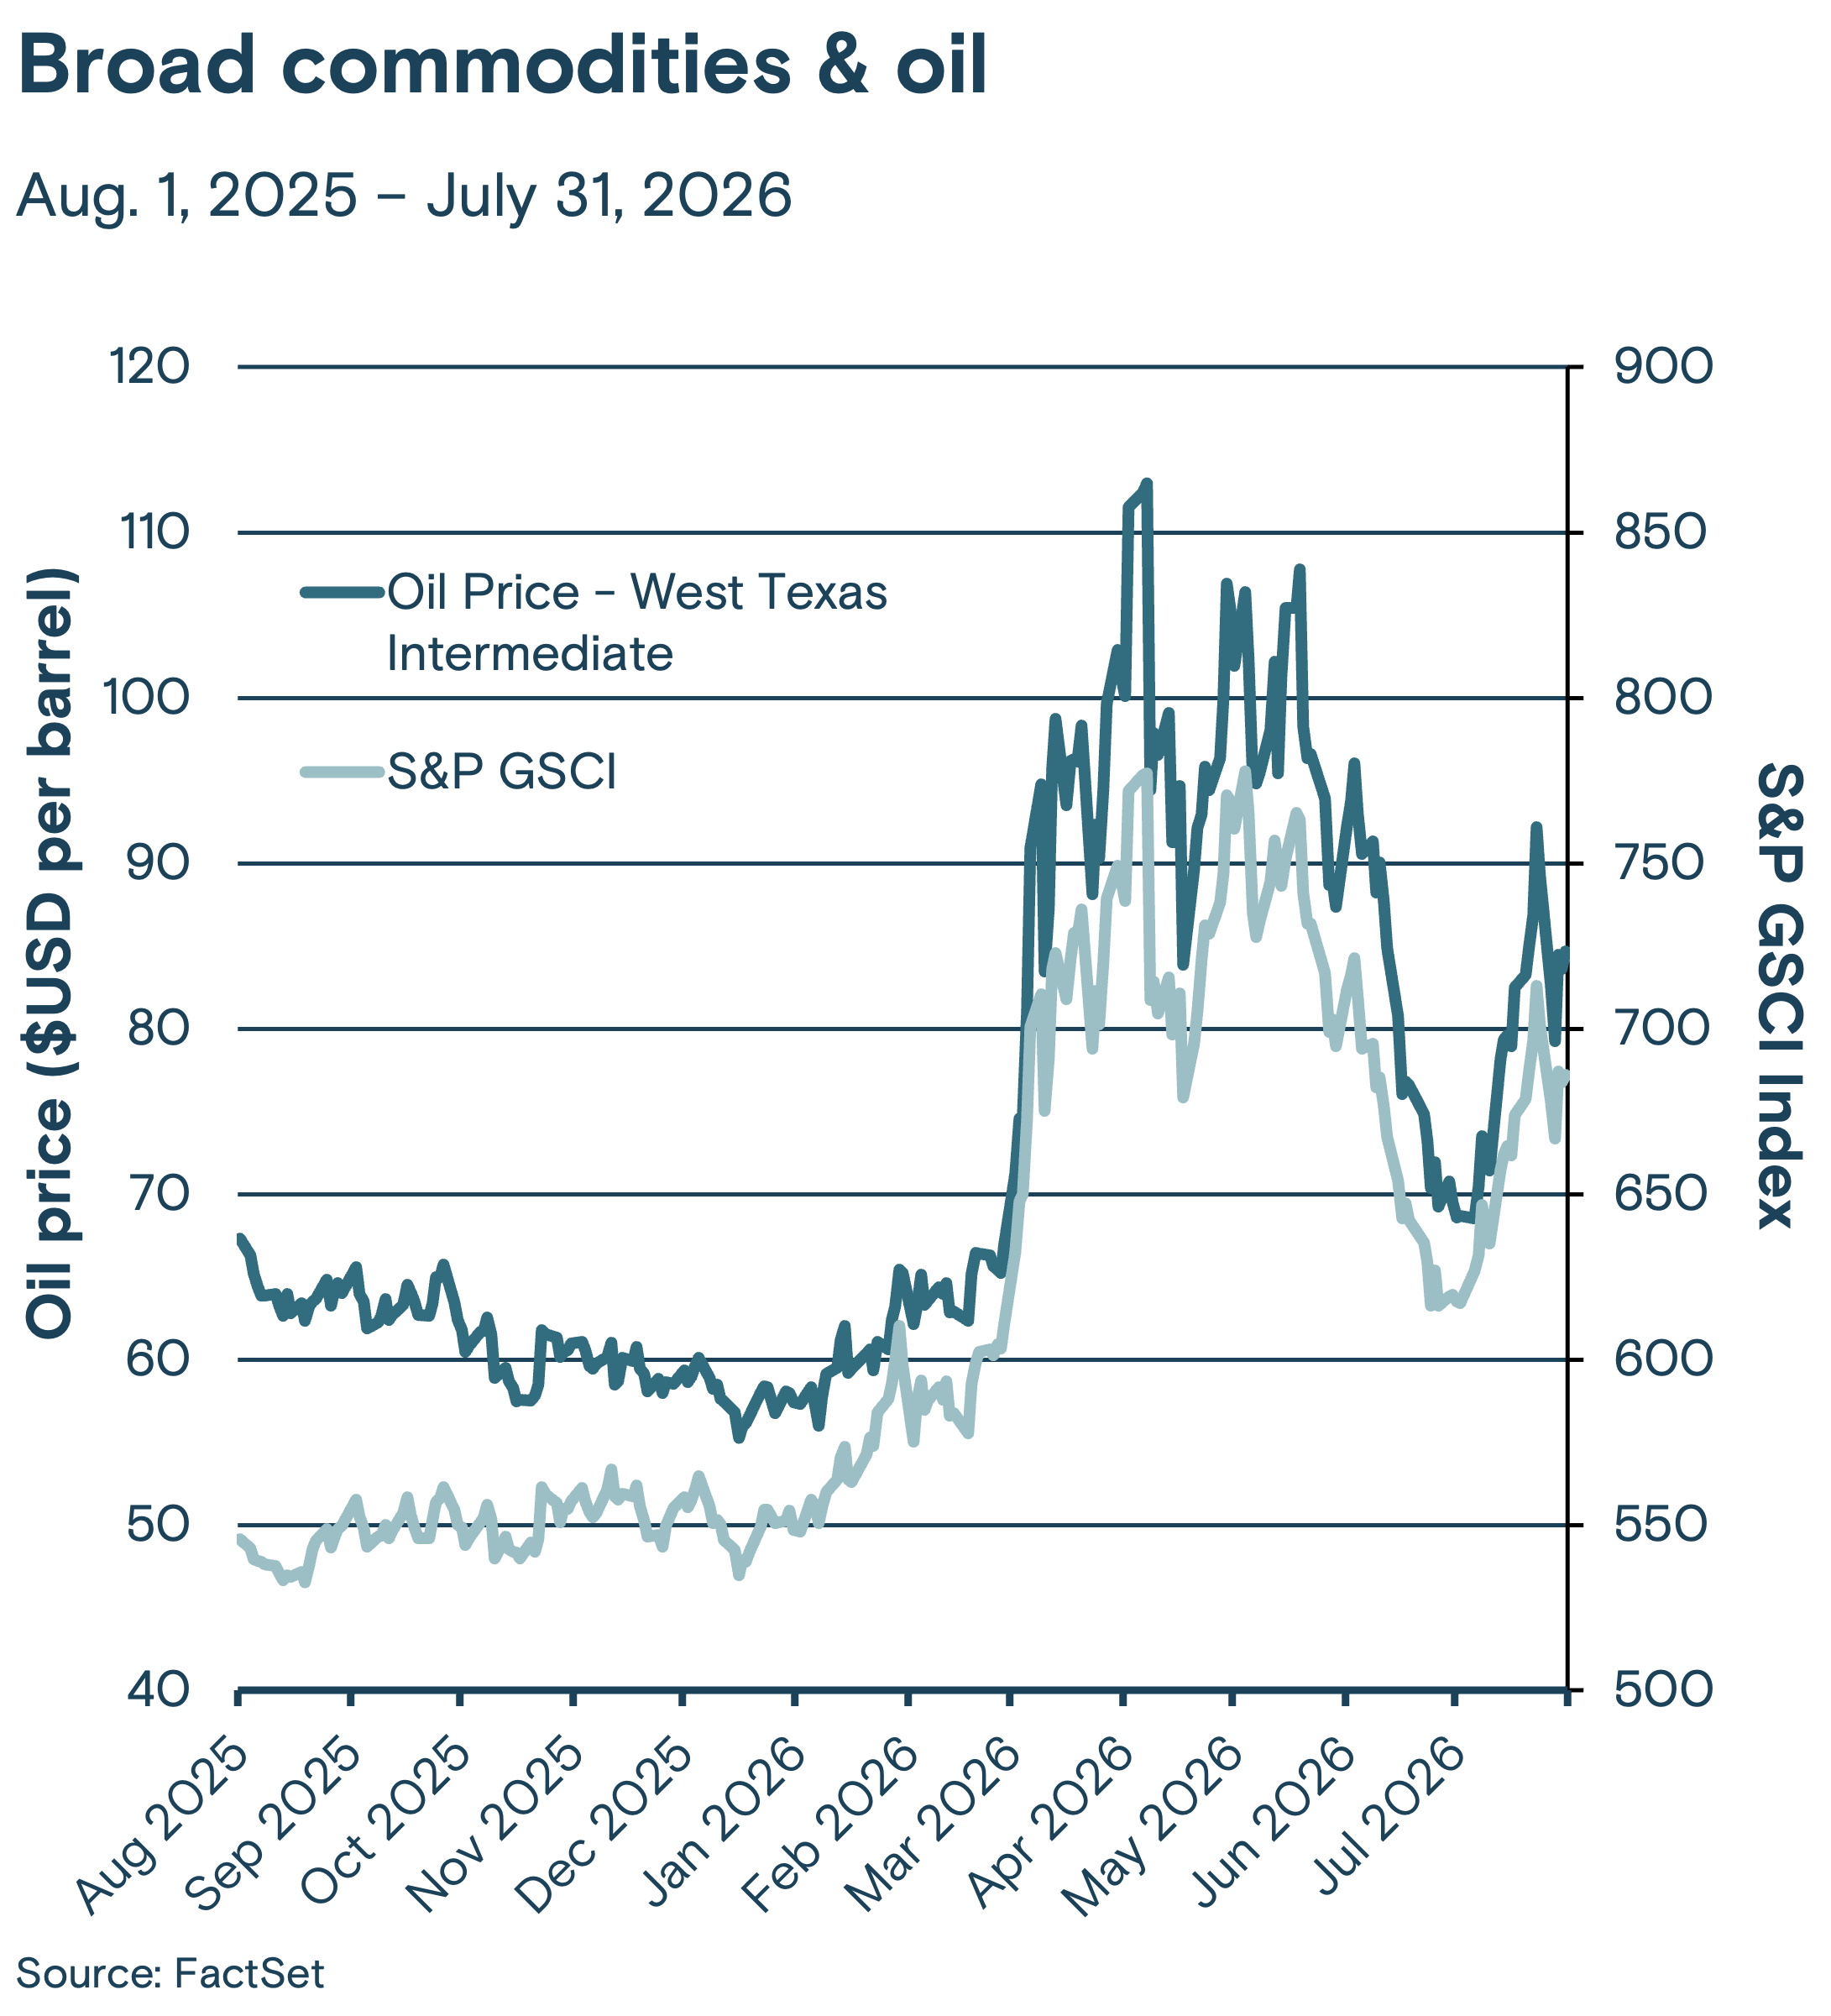
This line graph tracks the price of West Texas Intermediate crude oil and the S&P GSCI commodity index from August 2025 through July 2026.

Commodity prices have remained volatile as uncertainty about the outcome of the conflict in the Middle East persists, surging through much of July as negotiations toward a resolution of the conflict failed to materialize. Commodity prices remain a key factor in the outlook for inflation.

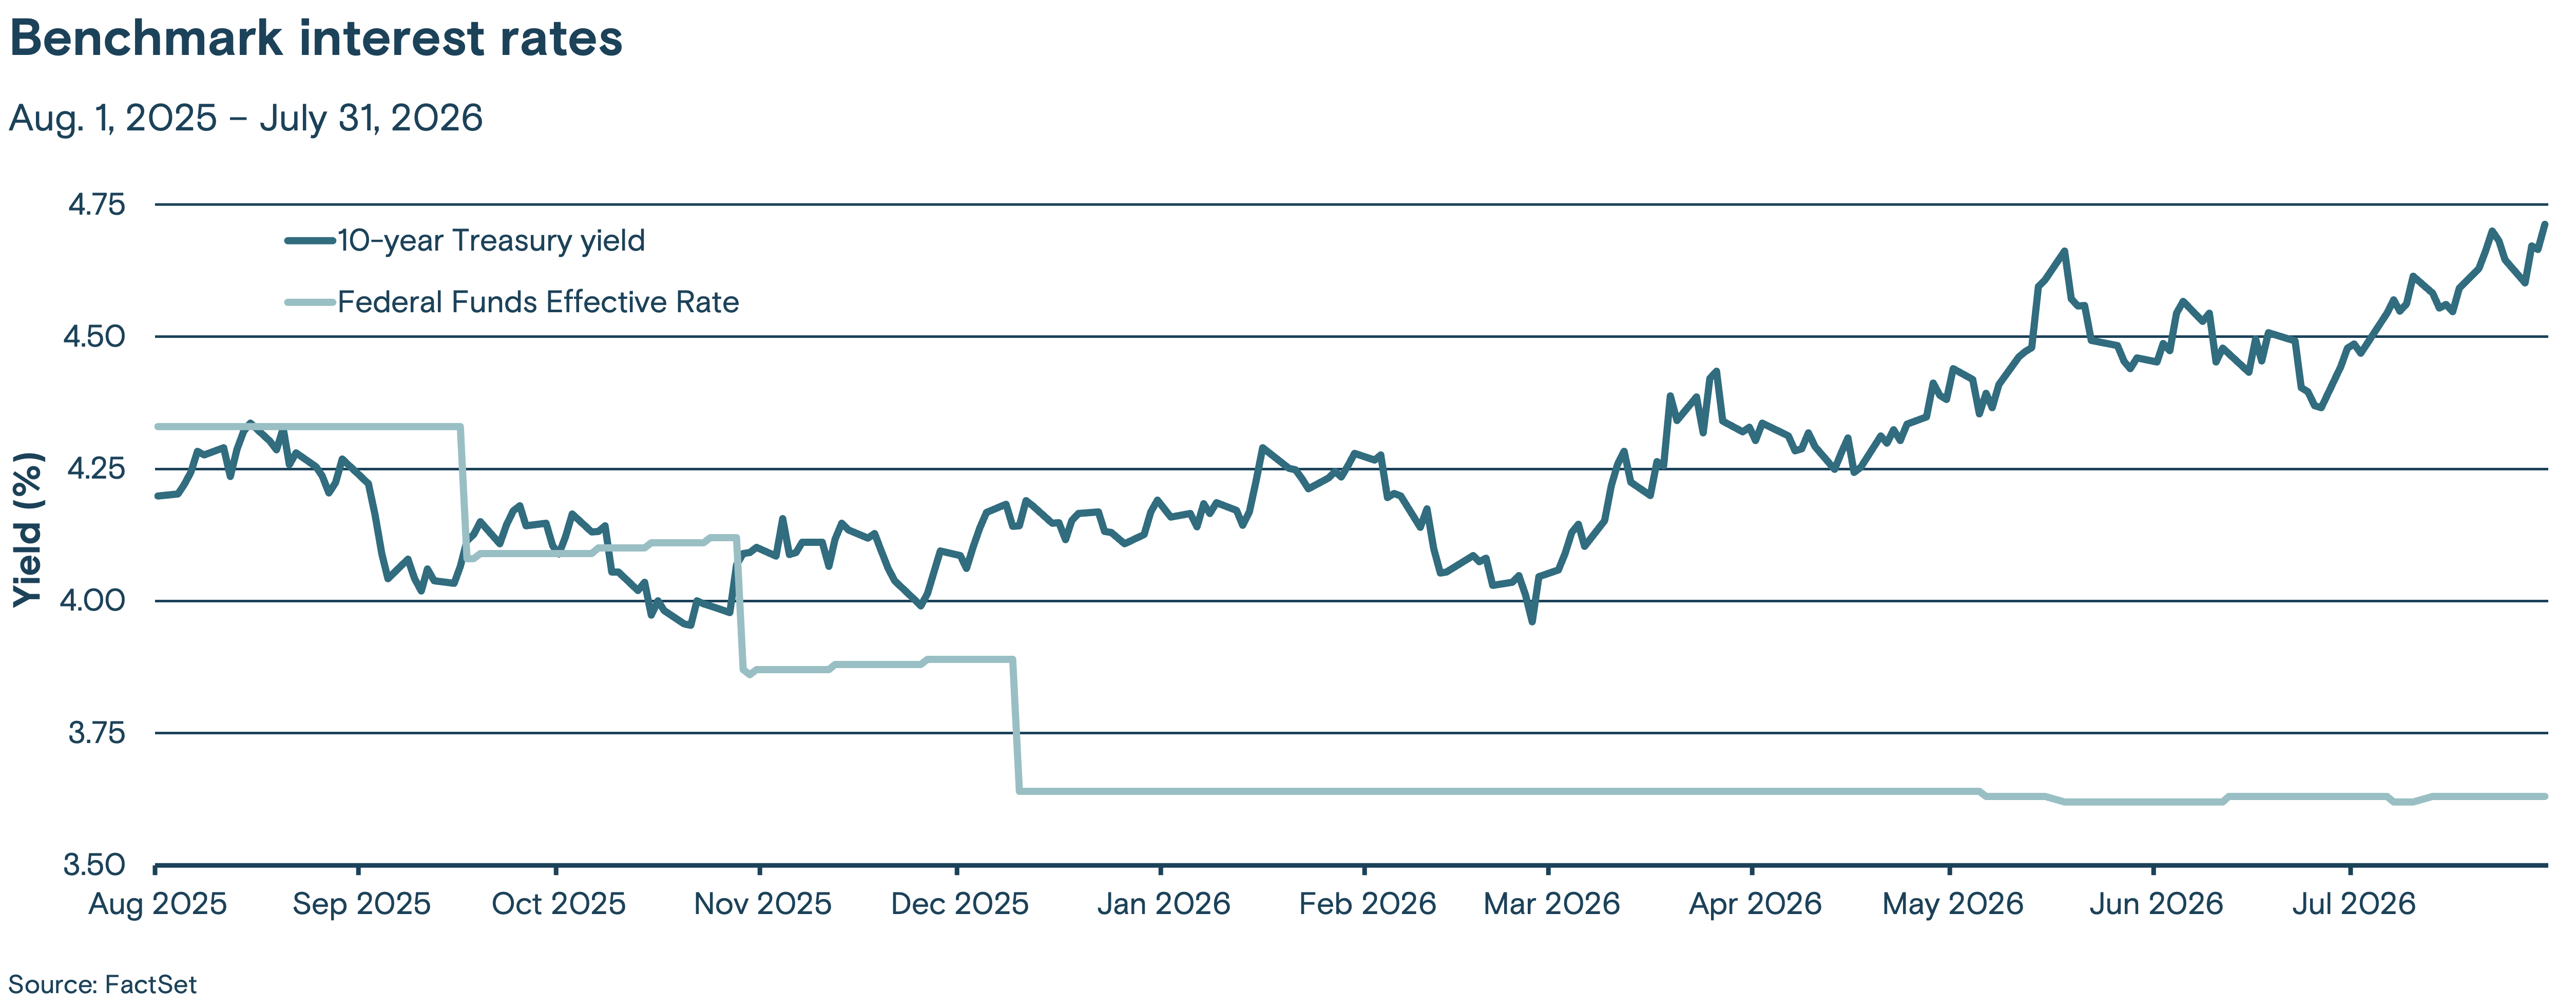
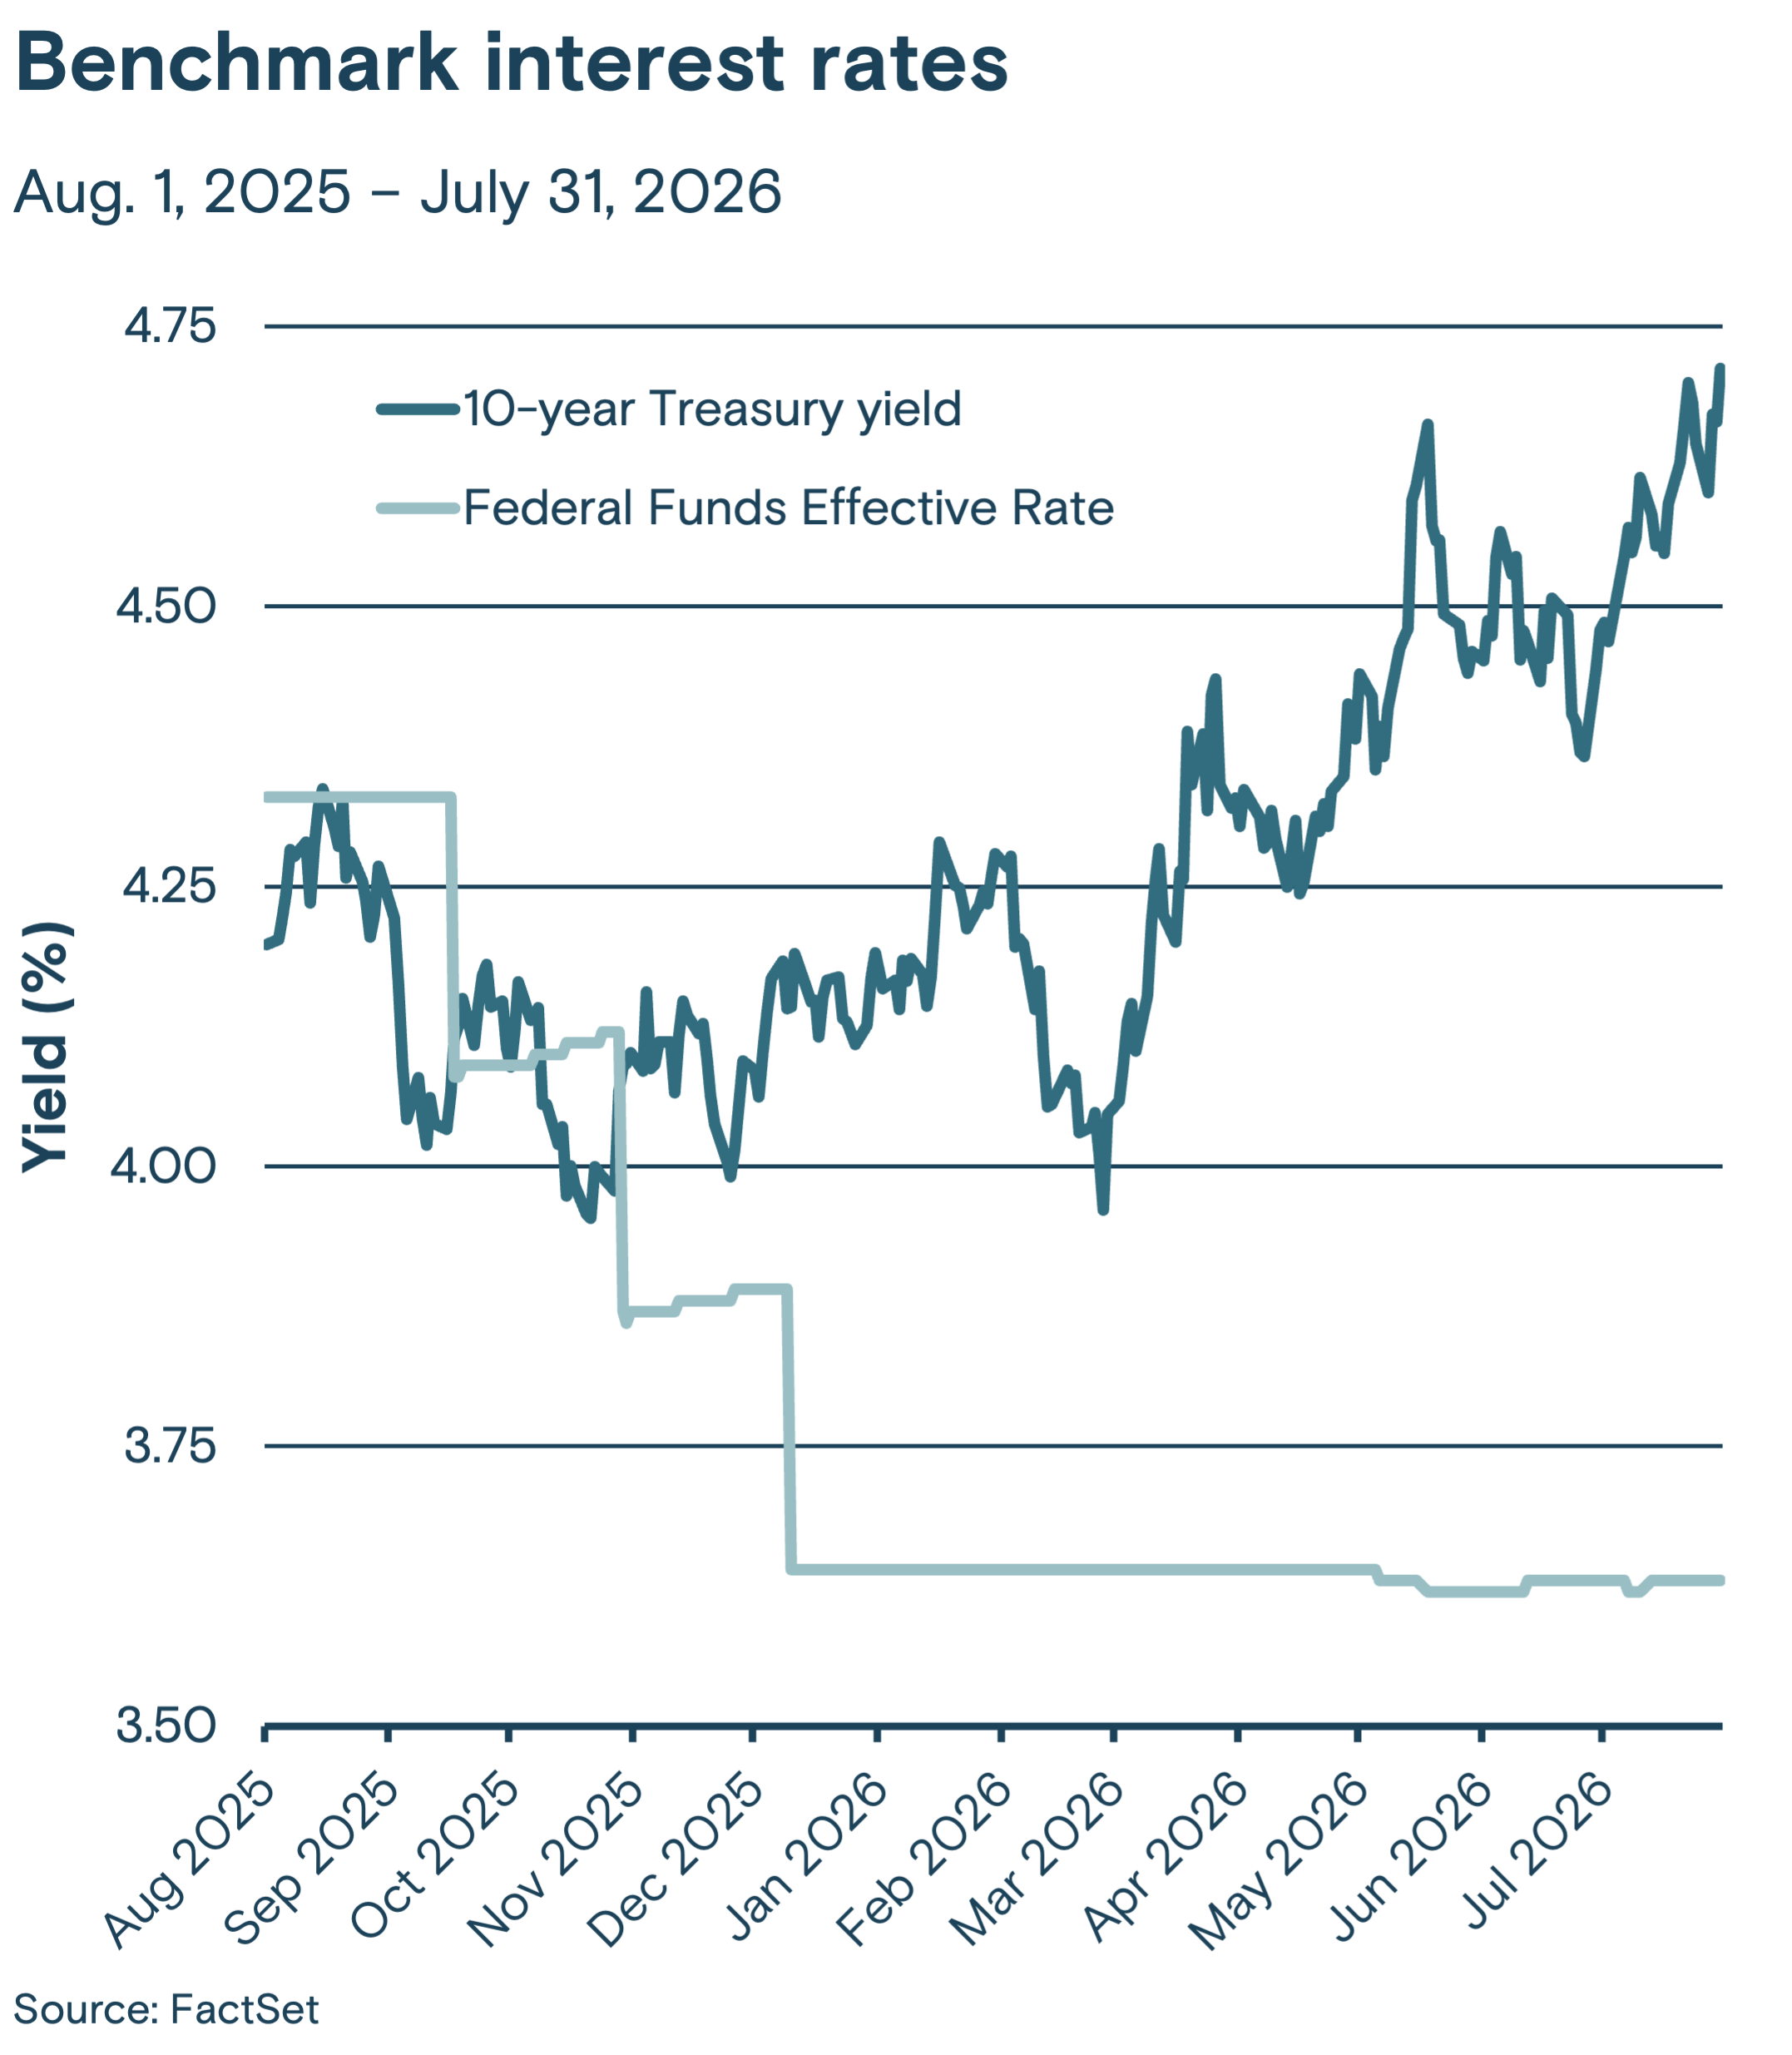
This line graph tracks two benchmark interest rates, the Federal Funds effective rate and the 10-year Treasury yield, from August 2025 through July 2026.

Benchmark 10-year Treasury yields have climbed steadily since the first quarter, setting a new high for the year at month-end before retreating in early August as tensions again cooled in the Middle East. Although inflation has recently moderated, expectations that it will remain above the Fed’s long-term target are increasing, raising the prospect that rates will remain higher for longer and pushing up yields across the yield curve.

Overall views

Asset class weighting

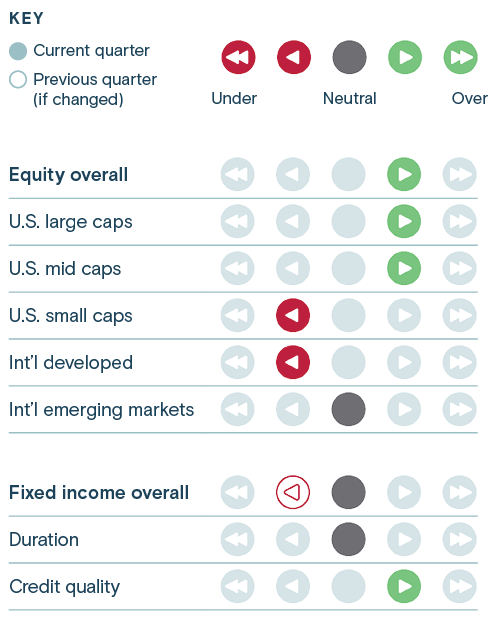
This graphic illustrates Thrivent Asset Management's asset class weighting for the current quarter for fixed income and equity.

Asset class weighting

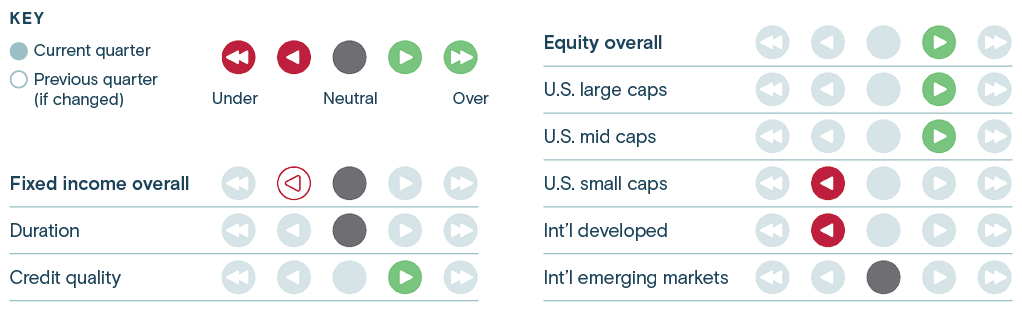
This graphic illustrates Thrivent Asset Management's asset class weighting for the current quarter for fixed income and equity.

Media contact: Callie Briese, 612-844-7340callie.briese@thrivent.com

All information and representations herein are as of 08/07/2026, unless otherwise noted.

The Thrivent Asset Management, LLC Senior Investment Team is discussing the asset classes, sectors and portfolios they oversee at a macroeconomic level.

The views expressed are as of the date given, may change as market or other conditions change, and may differ from views expressed by other Thrivent Asset Management, LLC associates. Actual investment decisions made by Thrivent Asset Management, LLC will not necessarily reflect the views expressed. This information should not be considered investment advice or a recommendation of any particular security, strategy or product. Investment decisions should always be made based on an investor's specific financial needs, objectives, goals, time horizon, and risk tolerance.

The Federal Funds effective rate is the interest rate at which depository institutions (mainly banks) lend reserve balances to other depository institutions overnight on an uncollateralized basis. In simpler terms, it's the rate banks charge each other for short-term loans to meet their reserve requirements.

Any indexes mentioned are unmanaged and do not reflect the typical costs of investing. Investors cannot invest directly in an index.

Related Insights