Now leaving ThriventFunds.com


You're about to visit a site that is neither owned nor operated by Thrivent Asset Management.

In the interest of protecting your information, we recommend you review the privacy policies at your destination site.

Financial Professional Site Registration

Complete this form to get full access to the entire financial professional site.

By clicking “Register”, you agree to our privacy and security policies and that you are a financial professional.

Access will be granted immediately, but the registration process may take up to 5 business days to complete.

Thank you for registering

You can now enjoy all financial professional content.

If your download does not start automatically, click here.

An error occurred

Please check back later.

CAPITAL MARKETS PERSPECTIVE: SEPTEMBER 2026

Healthy growth sends stocks to new highs

09/08/2026


Key points

Economic impact

Interest rates are unlikely to rise much further or fall quickly.

Market

Investors may want to consider rotating from cash to Treasuries and/or corporate bonds.


WRITTEN BY:
Chief Investment Strategist
WRITTEN BY:
Vice President, Model & Mixed Asset Portfolios
WRITTEN BY:
Steve Lowe, CFA,Chief Investment Strategist
David Spangler, CFA,Vice President, Model & Mixed Asset Portfolios

Thrivent Asset Management contributors to this report: Kent White, CFA, head of fixed income mutual funds; and John Groton, Jr., CFA, director of administration and materials & energy research


Key points

Economic growth stays healthy

The U.S. economy continues to grow, supported by a large investment cycle in AI and resilient consumers.

Stocks hit new highs

The S&P 500 Index set a new all-time high in August, with performance broadening into more cyclical sectors.

Treasuries remain attractive

Despite rising long-term yields, absolute levels are attractive and provide a compelling hedge against equity weakness.


Economy: The U.S. economy continues to grow at a healthy rate, supported by a large investment cycle in artificial intelligence (AI) and strong private sector demand. Consumer sentiment remains weak, though consumer spending has remained relatively strong despite signs of slowing demand (retail sales fell 0.6% in July, while credit card delinquencies rose). August’s job gains of 162,000, the strongest tally since March, were more than double expectations, leaving the unemployment rate at 4.1%. Inflation data remains high relative to the U.S. Federal Reserve’s (Fed) target rate of 2%, with July’s Core Personal Consumption Expenditures Index (PCE) rising 3.3% from last July.

We expect U.S. economic growth to remain healthy. The ability of companies investing heavily in AI to monetize their investments and increase earnings enough to justify their rich valuations remains uncertain, while conflict in the Middle East and the path of inflation and interest rates remain risks.

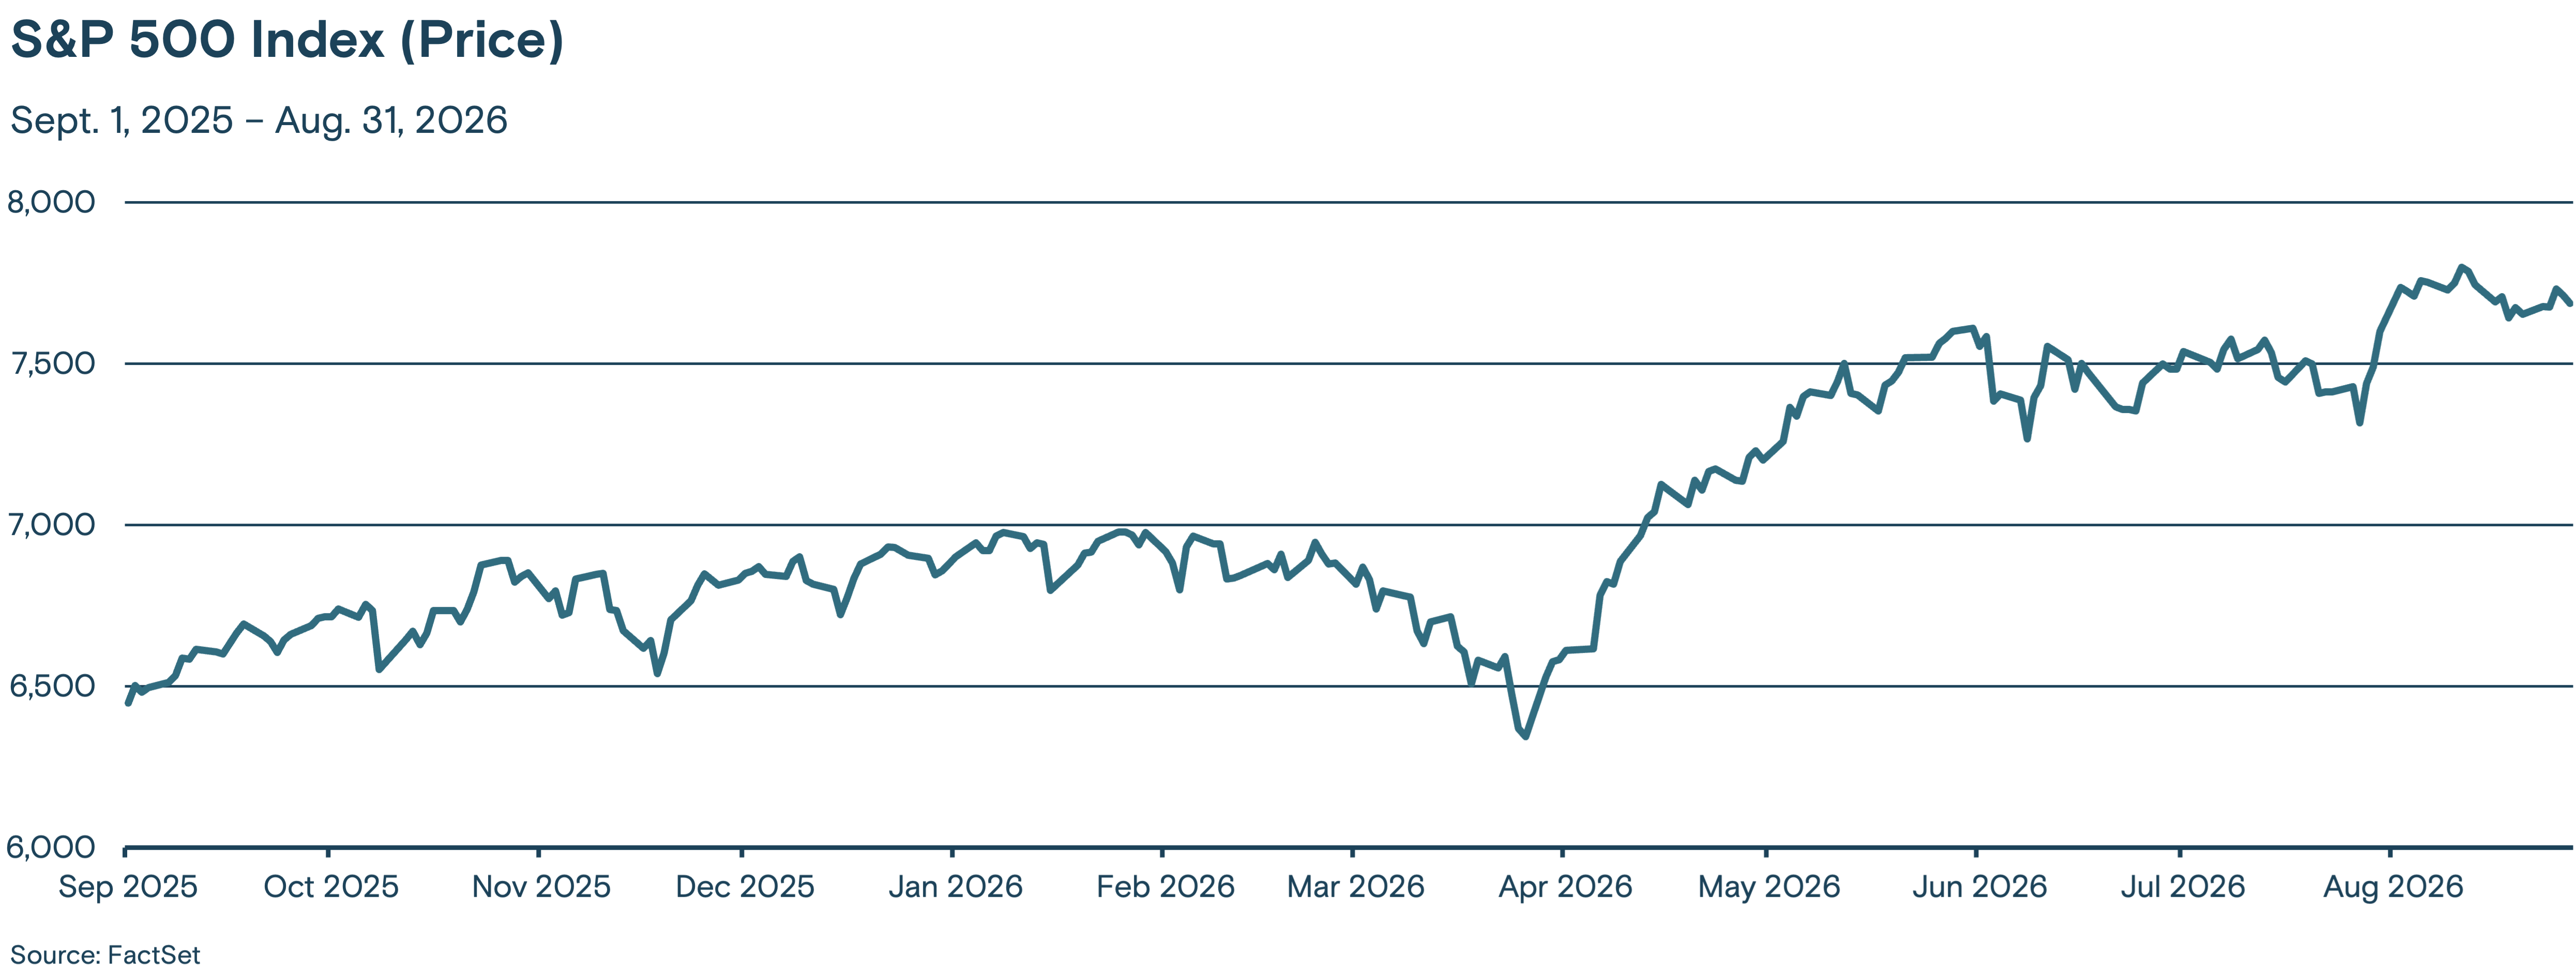
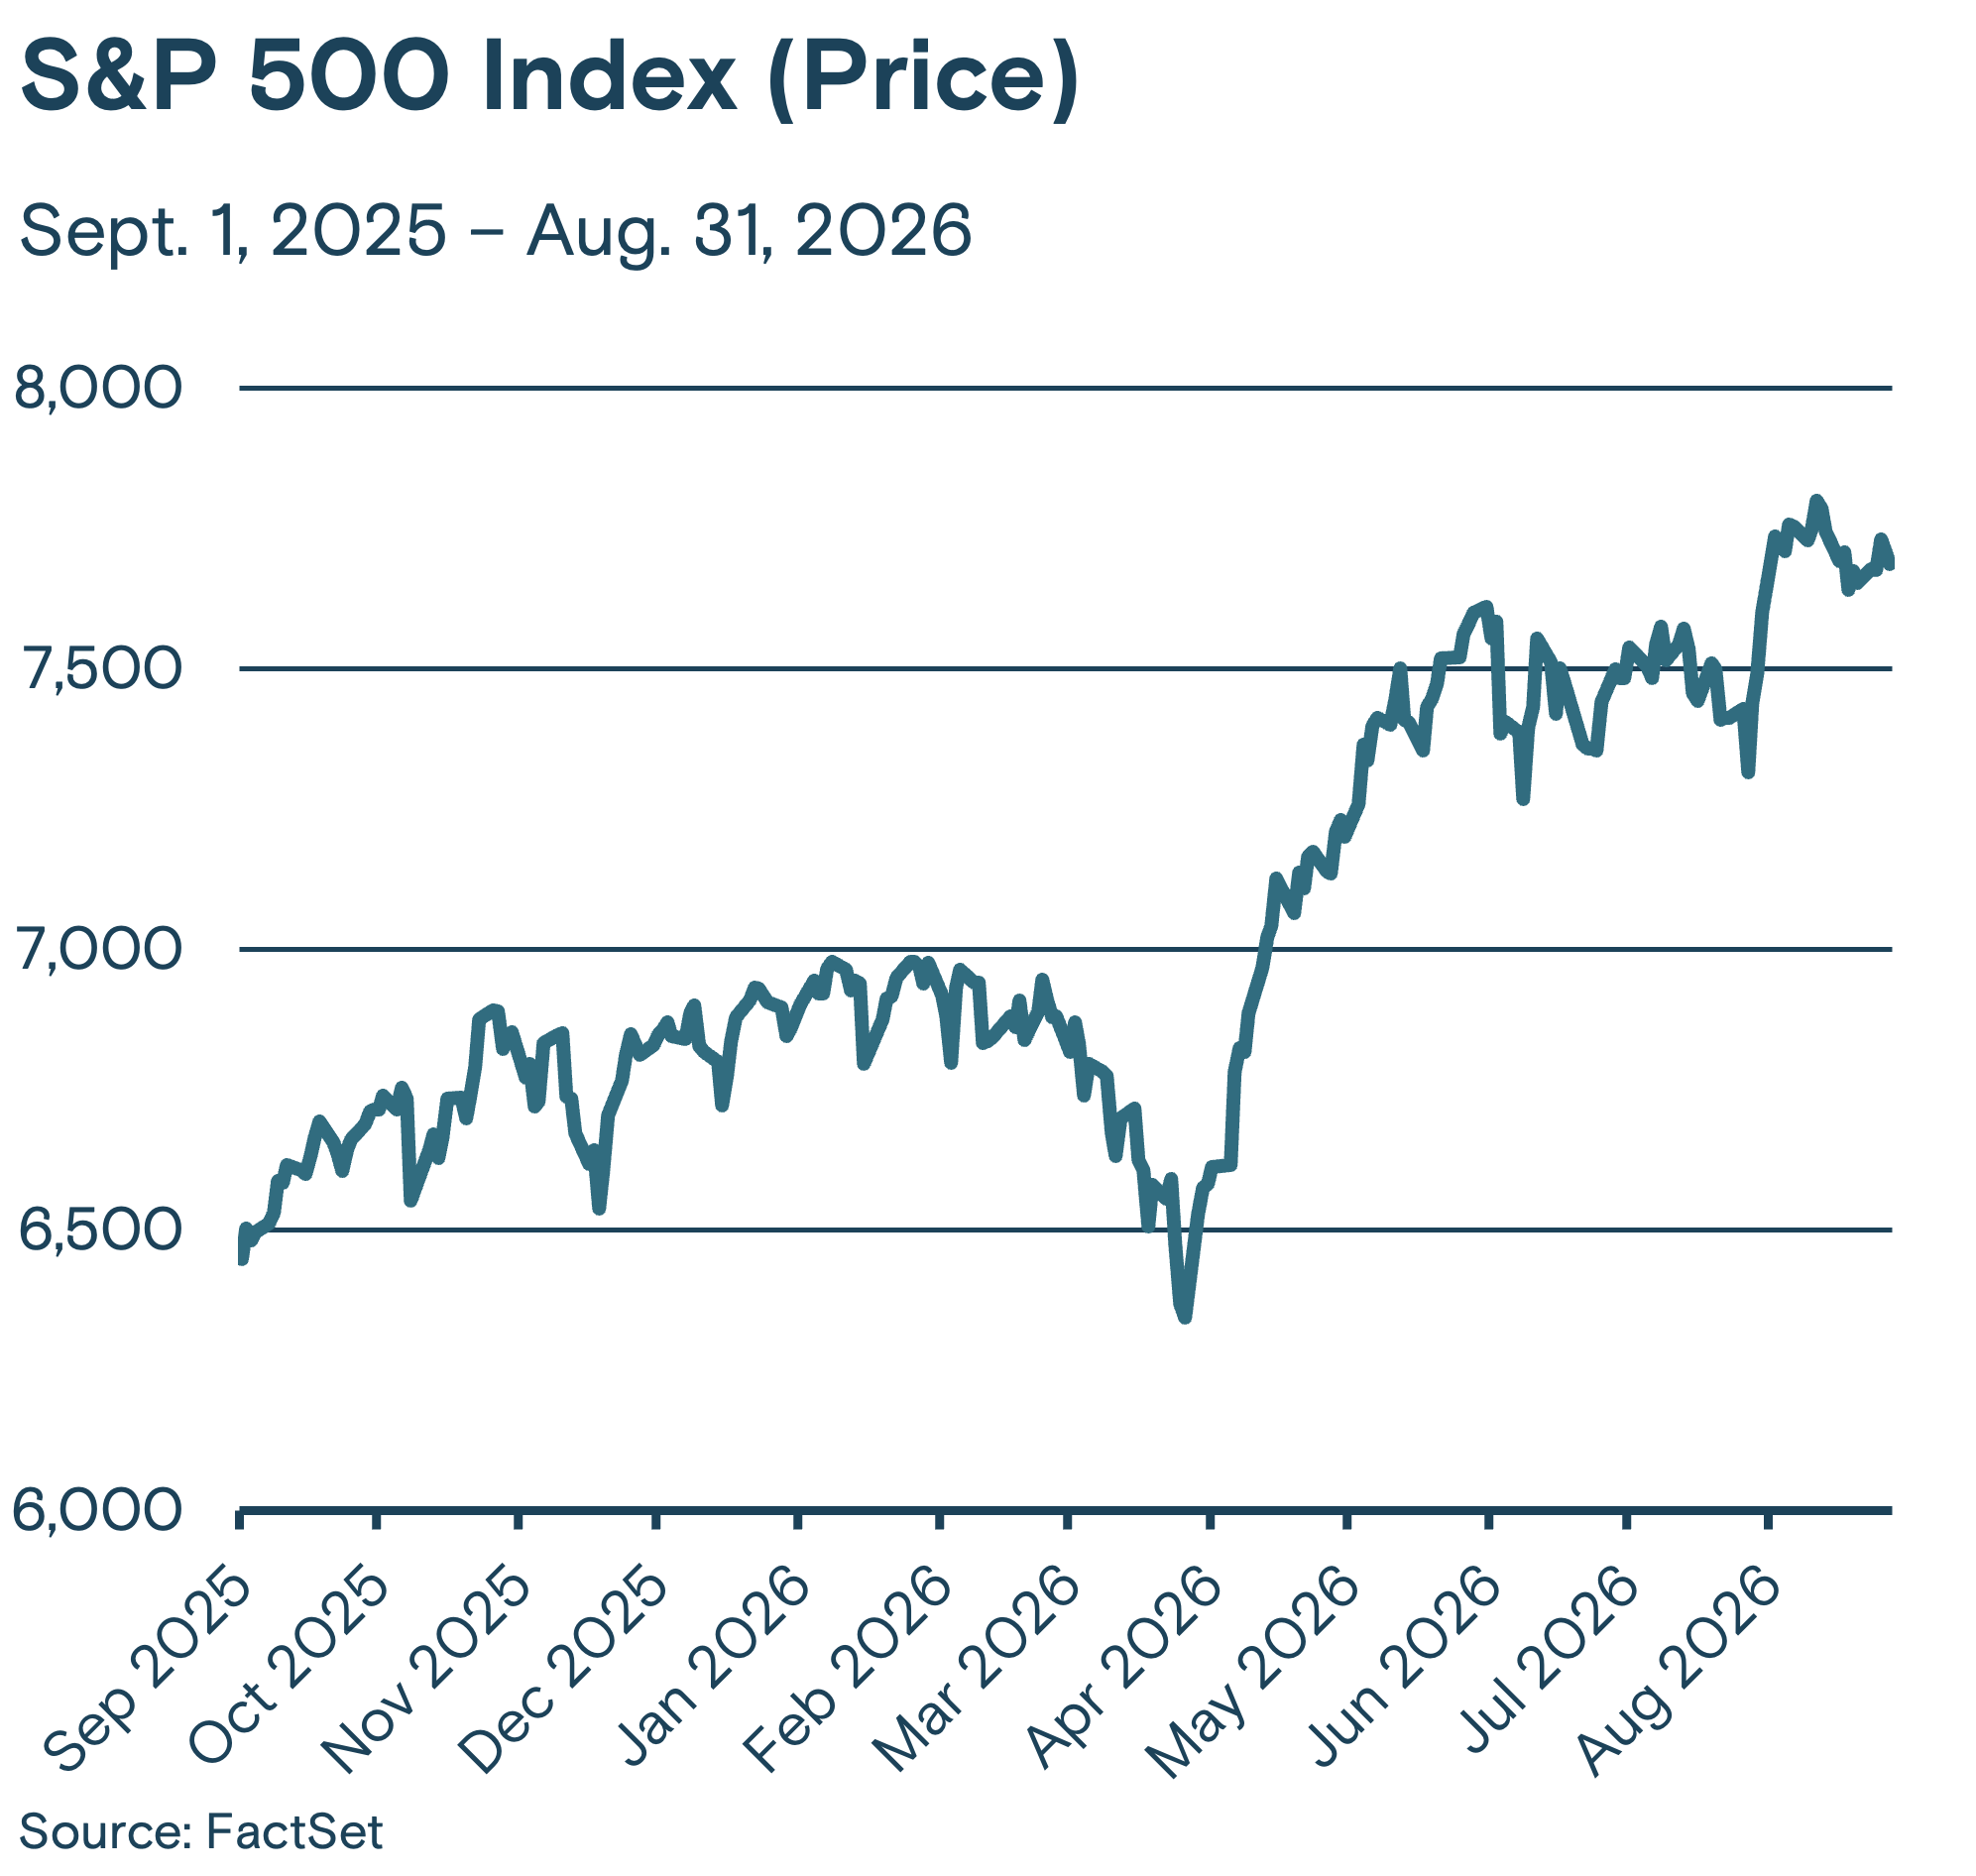
Stocks: The S&P 500® Index rose 2.62% in August, bringing its year-to-date return to 12.28%. The energy, information technology, materials and industrials sectors were standout performers, though strength across the index continued to disperse. Of note, AI leaders overall continued to produce strong earnings. Year to date, six of the Index’s 11 sectors are up more than 10%.

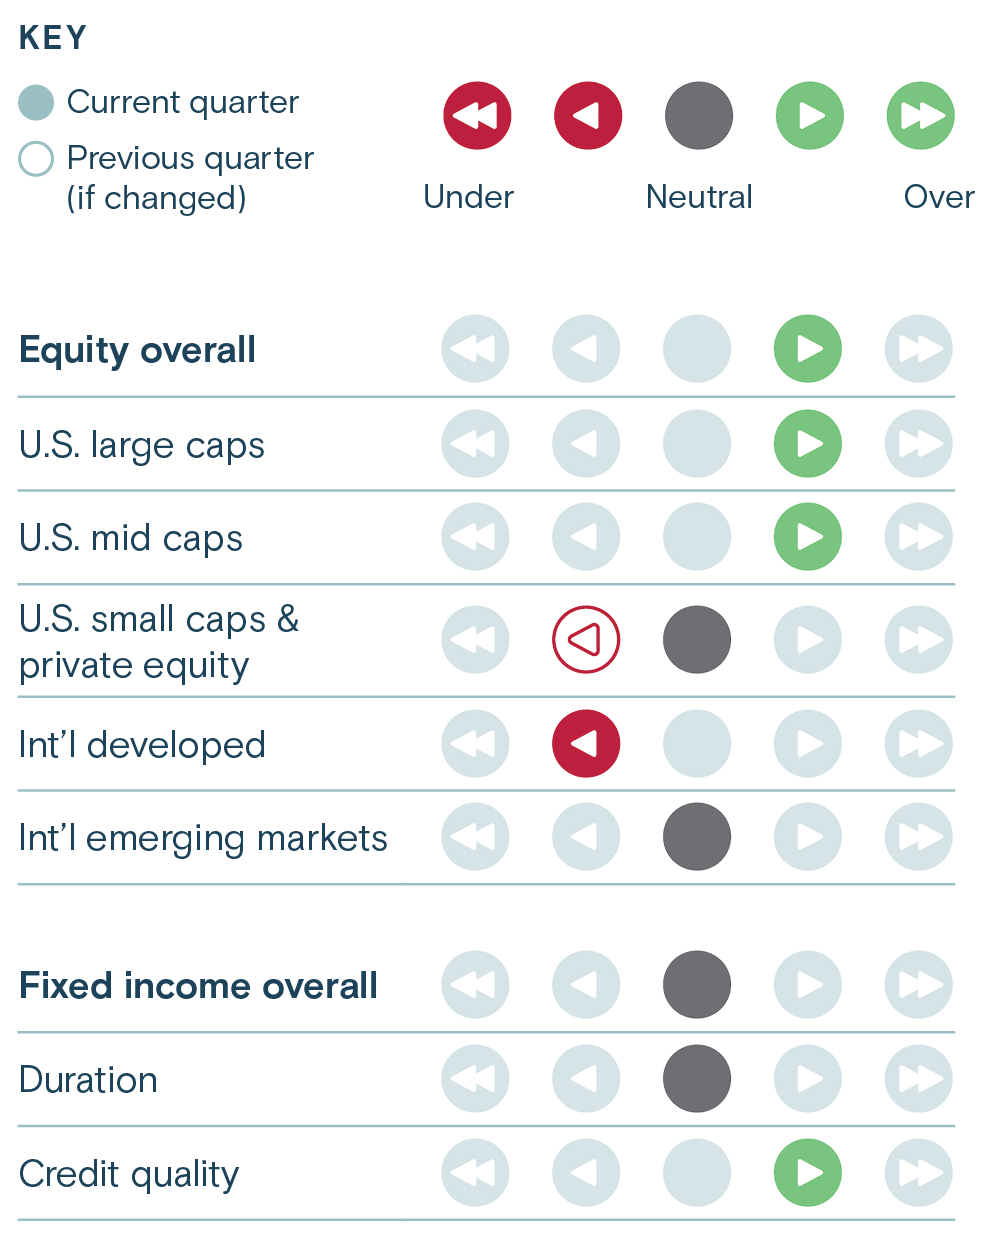
We expect the broadening of performance away from AI to more cyclical stocks to continue, supported by strong earnings and healthy economic growth. We remain moderately overweight large- and mid-cap stocks, and roughly neutral on small-cap stocks. Should equities fall significantly, we would look to add exposure to secular growth stocks at more attractive valuations, including AI leaders and beneficiaries of AI adoption.

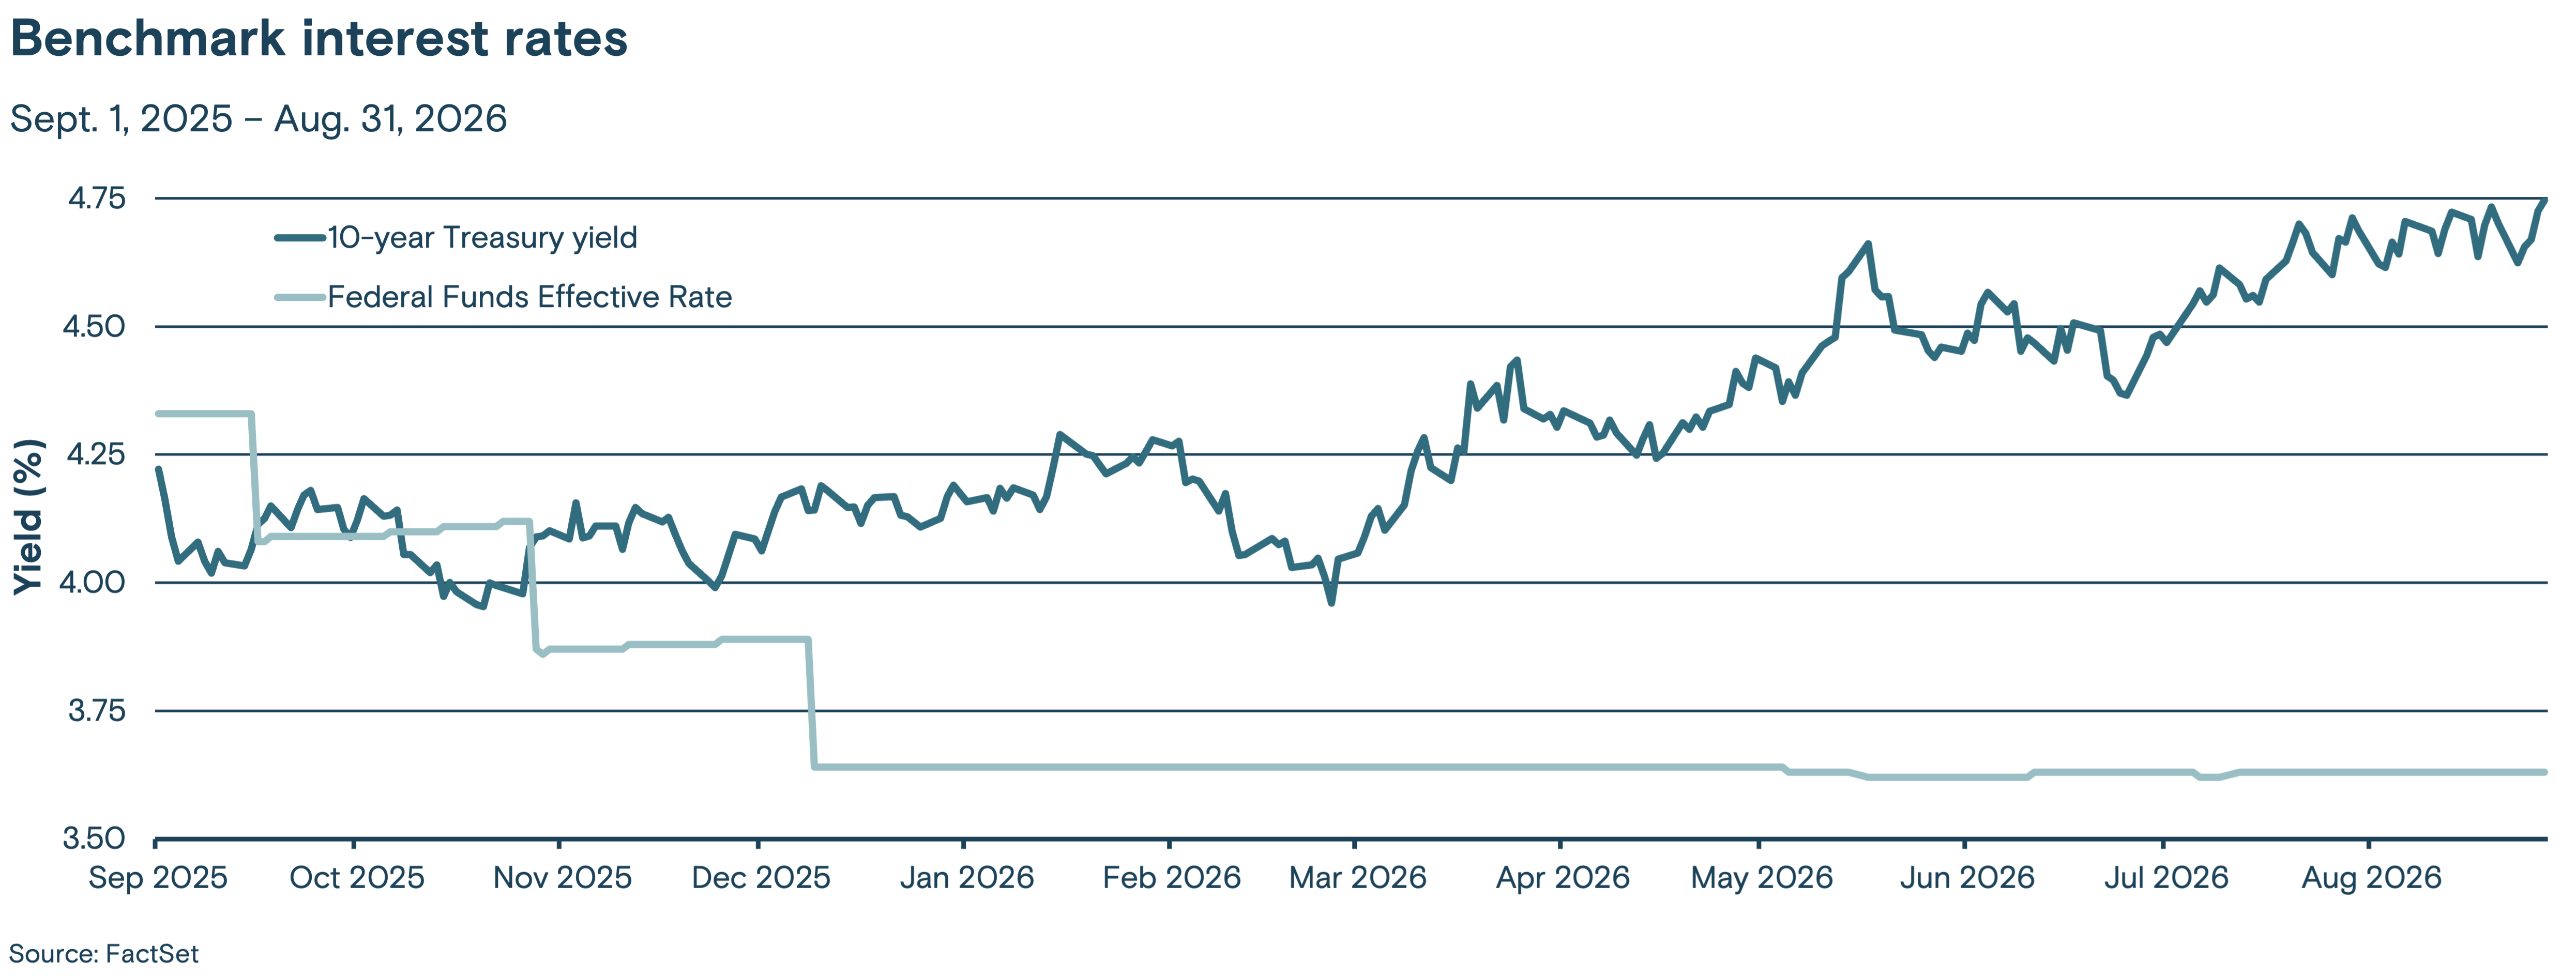
Bonds: The benchmark 10-year Treasury yield ended the month little changed from its July close (near multi-year highs). Shorter maturity Treasuries rose over the period as comments from Fed Chairman Kevin Warsh suggested rising interest rates were increasingly likely in the months ahead to help combat inflation. Longer maturity Treasury yields, including the 30-year Treasury bond, were volatile as the market digested concerns about budget deficits, persistent inflation and geopolitical pressures, such as the sustained conflict in the Middle East. Investment-grade corporate bond spreads were relatively stable during the period.

We remain relatively neutral in our interest rate exposure. We have a small overweight in longer-dated Treasuries given their high absolute yields and their ability to act as a hedge should equity markets sell off significantly. A key risk to that positioning is if higher rates are the catalyst for an equity selloff, but even then rates likely would eventually decline, boosting fixed income returns. Absent a deterioration in economic data, we likely expect the Fed will raise interest rates by 25 basis points in either October or December.
September highlights

This chart depicts the value of the S&P 500 Index from September 2025 through August 2026.

U.S. stock market indices, including the S&P 500 Index, Nasdaq Composite Index and Russell 2000 Index, have all risen by double digits this year. Buoyed by strong earnings amid sustained economic growth, the strength in stocks underscores the U.S. economy's resilience. While challenges remain, including the ability of AI to generate expected productivity gains, sustained inflation and geopolitical conflict, we maintain our positive outlook for U.S. equities.

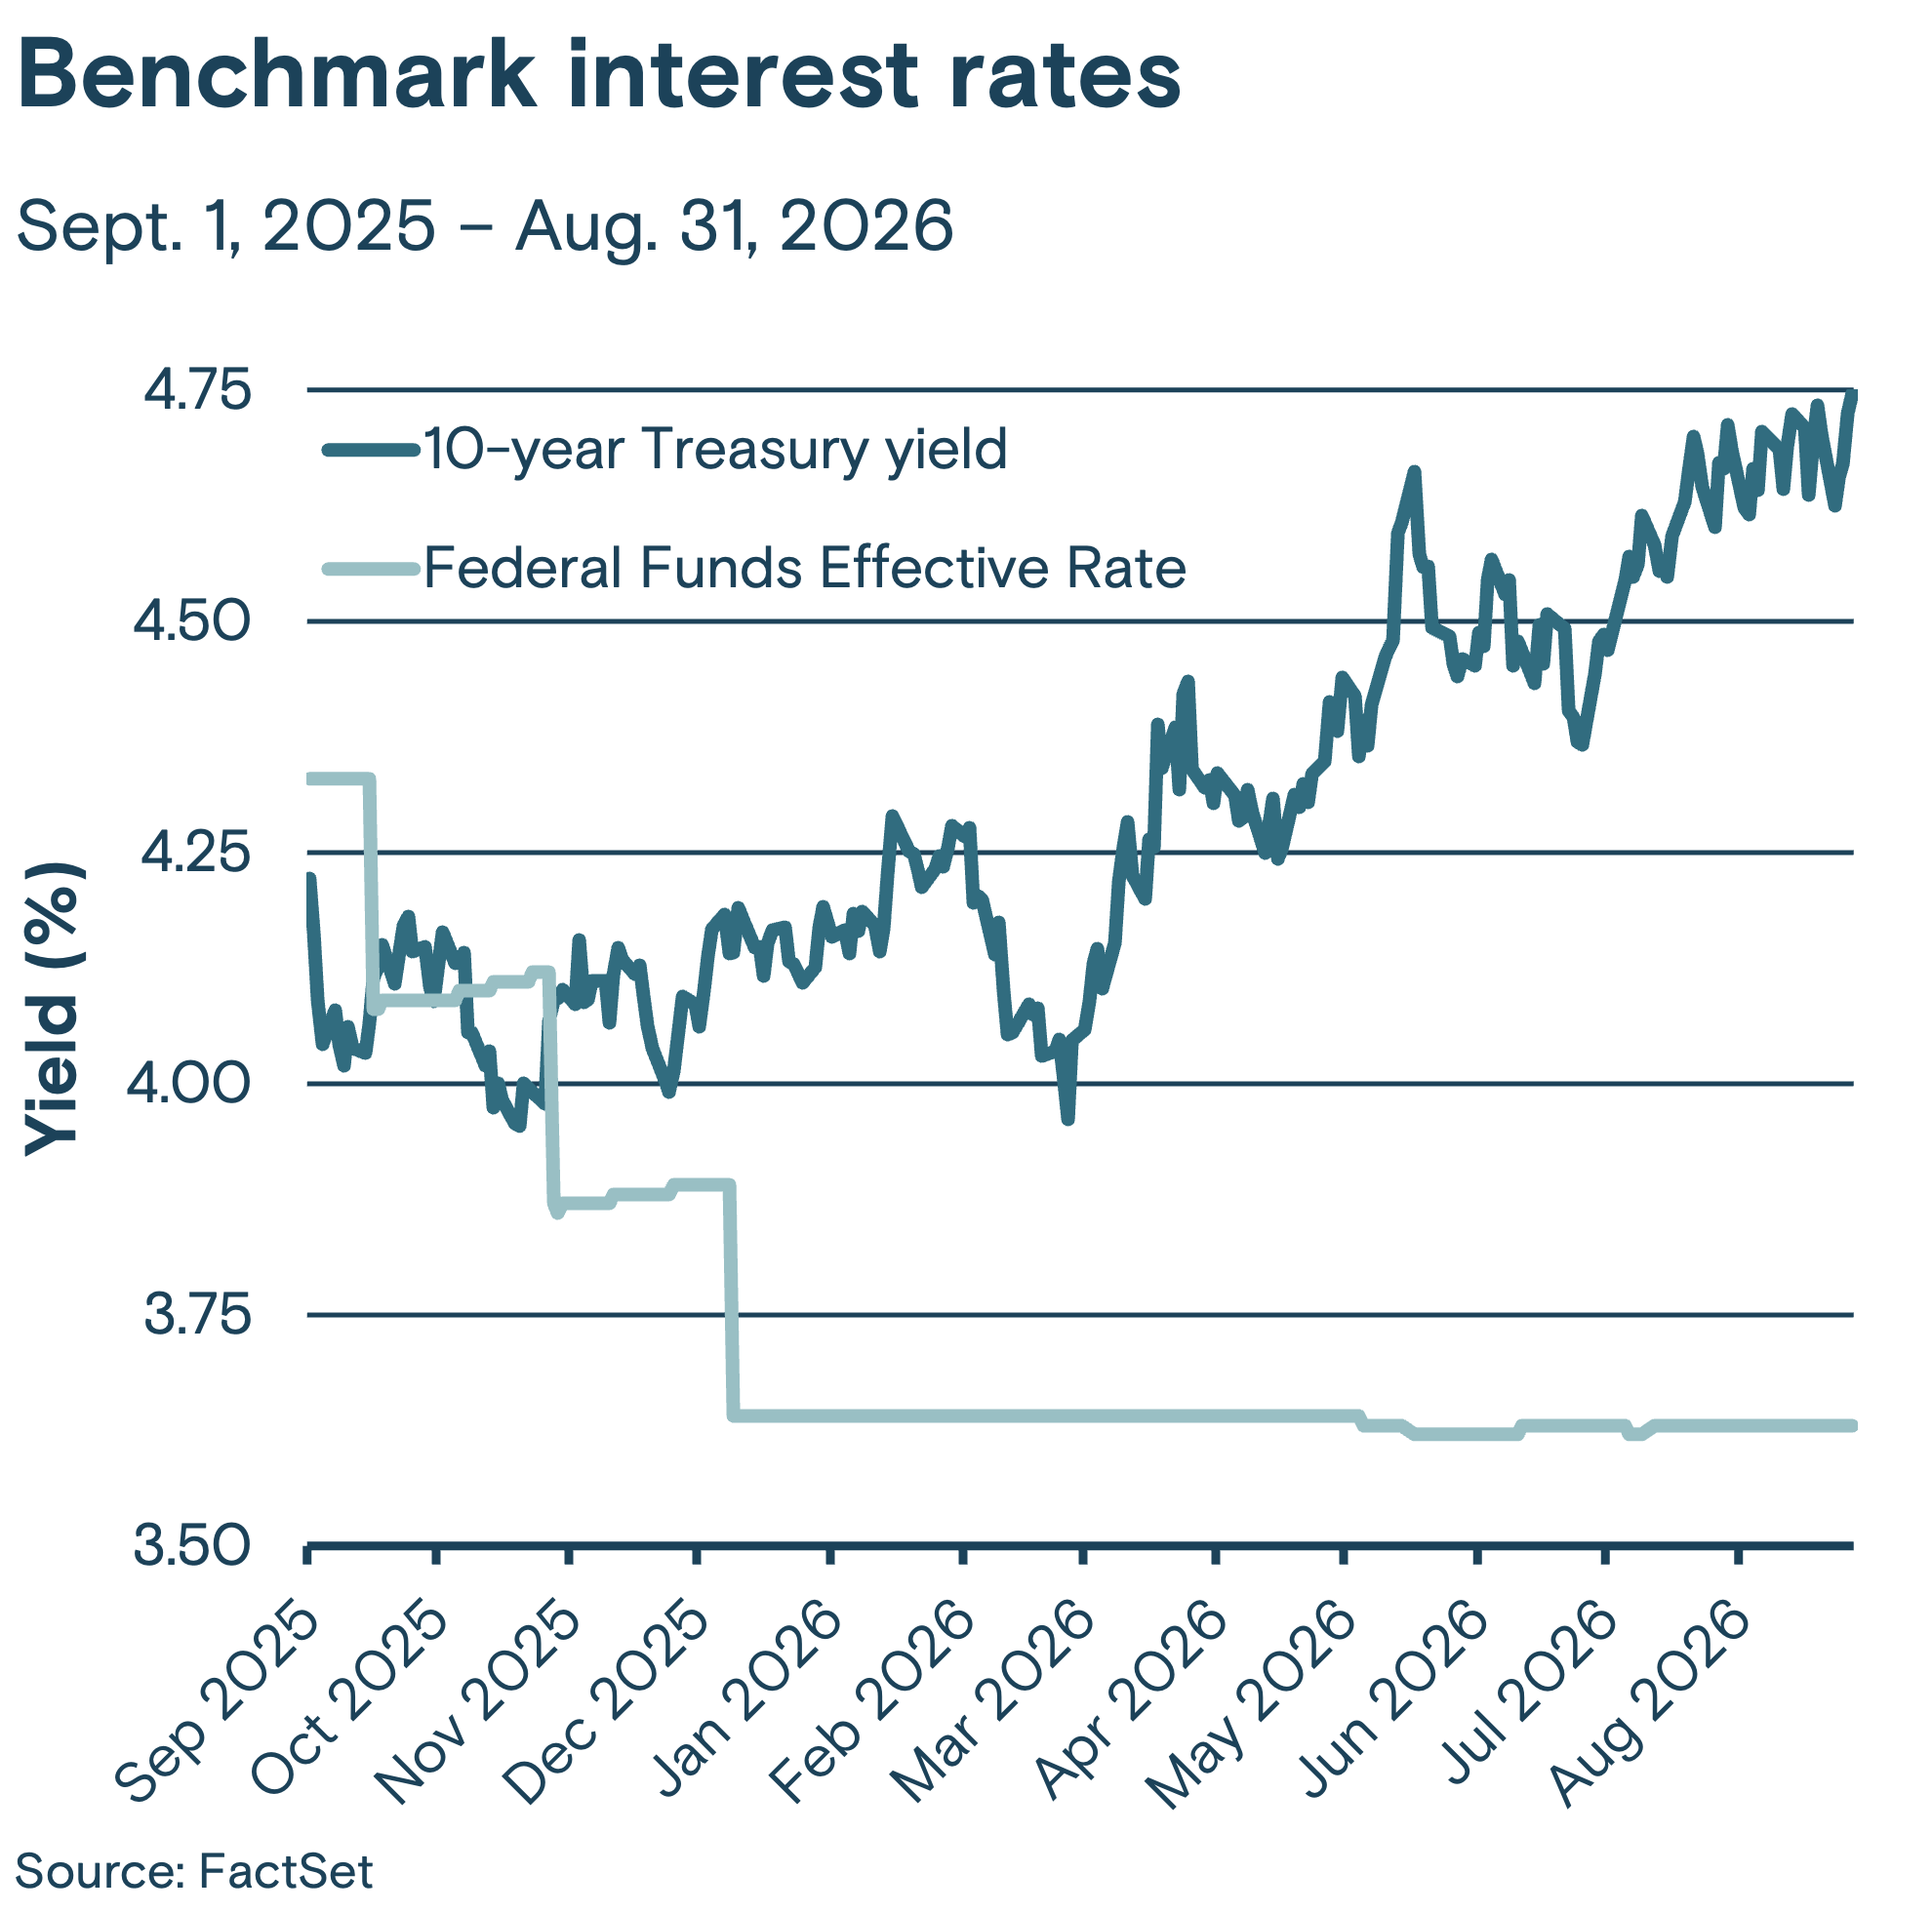
This line graph tracks two benchmark interest rates, the Federal Funds effective rate and the 10-year Treasury yield, from September 2025 through August 2026.

Benchmark 10-year Treasury yields remain near their short-term highs. Should they rise a further 25 basis points, to 5.0%, they would be near levels not seen since before the Global Financial Crisis. While recent inflation data suggests some stability near current levels, it remains sufficiently above the Fed’s long-term target. As such, markets increasingly expect interest rates to remain higher for longer. Additionally, with total outstanding federal debt reaching a record $40 trillion in August, attention has returned to the cost of financing this debt, putting further upward pressure on yields.

Overall views

Asset class weighting

This graphic illustrates Thrivent Asset Management's asset class weighting for the current quarter for fixed income and equity.

Asset class weighting

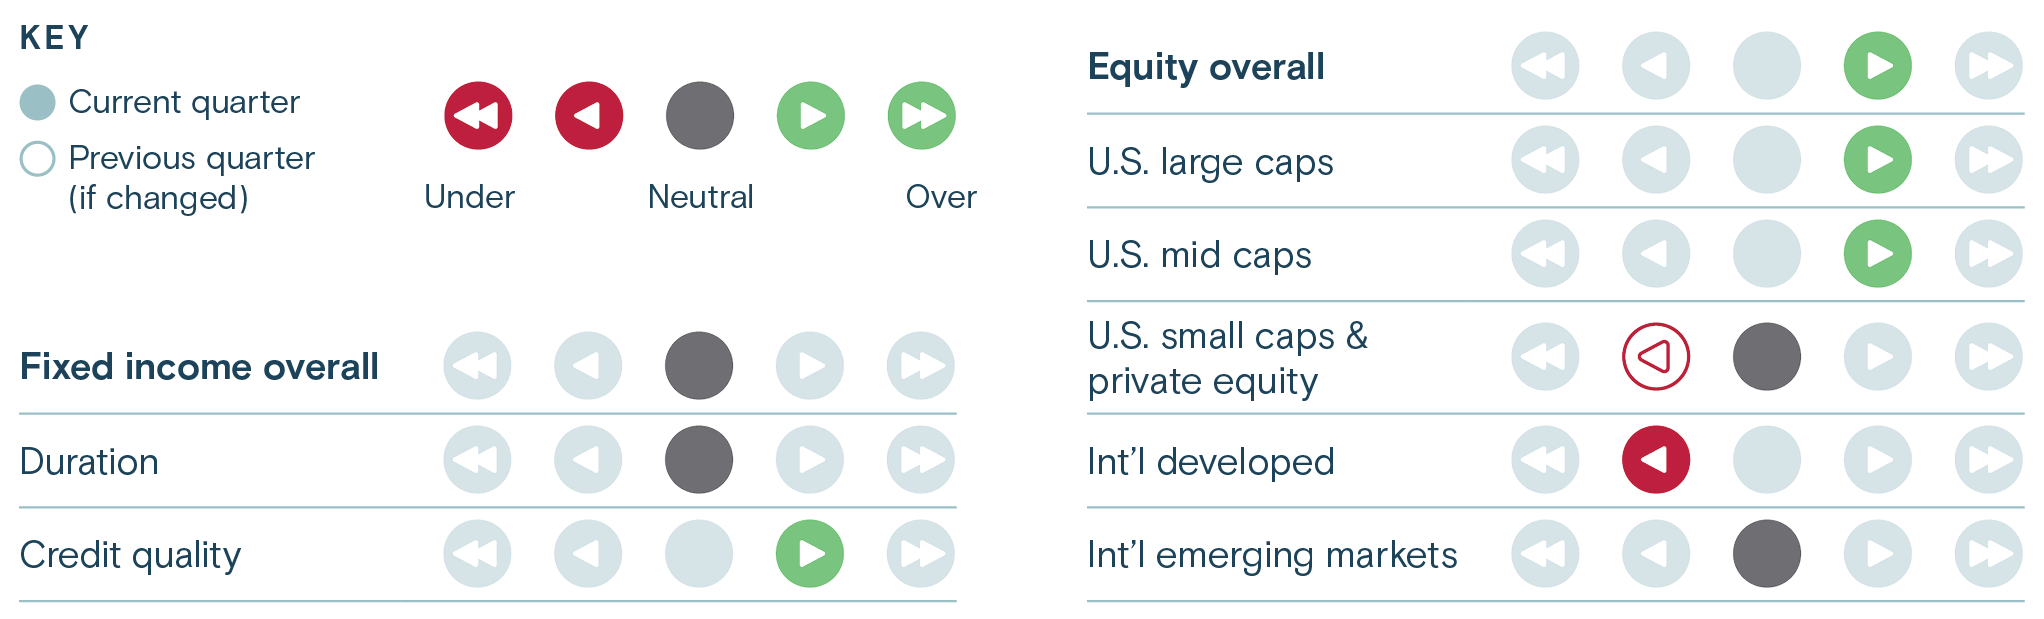
This graphic illustrates Thrivent Asset Management's asset class weighting for the current quarter for fixed income and equity.

Media contact: Callie Briese, 612-844-7340callie.briese@thrivent.com

All information and representations herein are as of 09/08/2026, unless otherwise noted.

The views expressed are as of the date given, may change as market or other conditions change, and may differ from views expressed by other Thrivent Asset Management, LLC associates. Actual investment decisions made by Thrivent Asset Management, LLC will not necessarily reflect the views expressed. This information should not be considered investment advice or a recommendation of any particular security, strategy or product. Investment decisions should always be made based on an investor's specific financial needs, objectives, goals, time horizon, and risk tolerance.

The Federal Funds effective rate is the interest rate at which depository institutions (mainly banks) lend reserve balances to other depository institutions overnight on an uncollateralized basis. In simpler terms, it's the rate banks charge each other for short-term loans to meet their reserve requirements.

Any indexes mentioned are unmanaged and do not reflect the typical costs of investing. Investors cannot invest directly in an index.

Past performance is not necessarily indicative of future results.