Small caps: Earnings improvements meet attractive valuations [VIDEO]
Today’s market environment may be creating new opportunities in small-cap investing.
07/08/2026
CAPITAL MARKETS PERSPECTIVE: Q3 2026
07/08/2026
Investors may want to consider rotating from cash to Treasuries and/or corporate bonds.
Thrivent Asset Management contributors to this report: Kent White, CFA, head of fixed income mutual funds; David Spangler, CFA, vice president, model & mixed asset portfolios; and John Groton, Jr., CFA, director of administration and materials & energy research
New leadership and persistent higher inflation measures signal changes coming.
Increase in AI-related capital spending is starting to switch to erosion of free cash flow.
Markets are starting to broaden beyond large-cap technology stocks.
Strong earnings have been a key positive driver of equities this year.
U.S. economic data is generally outperforming expectations, resulting in solid economic growth supported by a resilient consumer, massive capital spending on artificial intelligence (AI) infrastructure, productivity gains, lower tax rates and tax law changes promoting business investment.
A stronger labor market has been an encouraging development, with the last three monthly employment reports showing job growth averaging nearly 190,000 per month, after accounting for revisions. Additionally, the weekly initial jobless claims data, which only counts individuals who file for unemployment for the first time that week, have been near their lowest levels since the late 1960s.
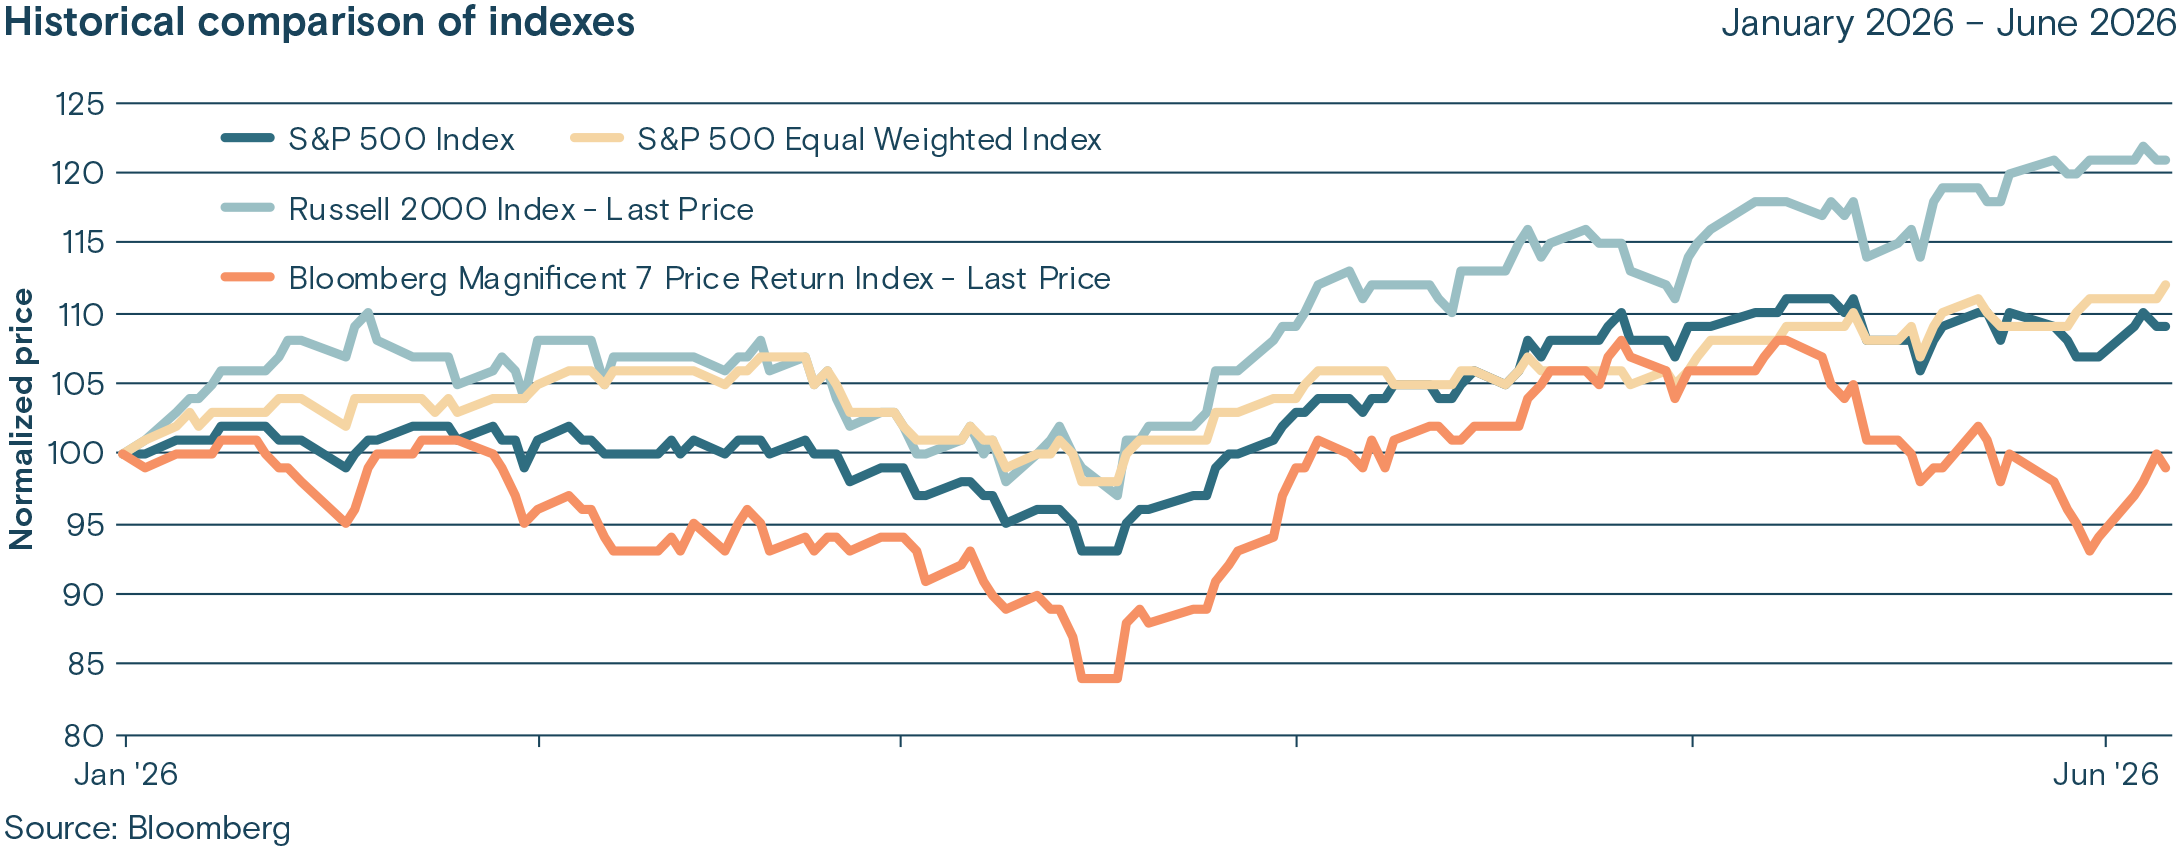
Our base case is U.S. economic growth will remain solid, but the ability of AI leaders to monetize their investments and increase earnings enough to justify their rich valuations remains uncertain. In the long run, we think AI will not just provide ongoing productivity gains but will ultimately prove revolutionary. Nevertheless, expectations are high, and bouts of uncertainty will lead to volatility, such as the sharp decline in the S&P 500® Index in early June.
Inflation remains an ongoing concern. It has been above the U.S. Federal Reserve’s (Fed) 2% target since 2021, raising concerns that inflation expectations could rise, risking a self-fulfilling prophecy. Despite excluding the more volatile food and energy prices, the Core Consumer Price Index (CPI) and Core Personal Consumption Expenditures (PCE) Price Index have risen steadily since February. While oil prices have fallen recently, we expect continued uncertainty about the conflict in the Middle East, solid consumer spending and strong demand for AI infrastructure, such as semiconductors and computing equipment, to keep core inflation above the Fed’s 2% target.
After the Fed’s June meeting, new Chairman Kevin Warsh was notably more hawkish (focusing more on inflation risks than stimulating economic growth) than the market was expecting, with nine of the committee’s 18 members projecting at least one interest-rate hike by the end of the year, including six members who projected more than one hike. We believe the Fed is likely to raise rates this year, possibly as soon as the September meeting, given the recent rise in core inflation and our expectation that Chairman Warsh will want to signal his commitment to combating inflation.
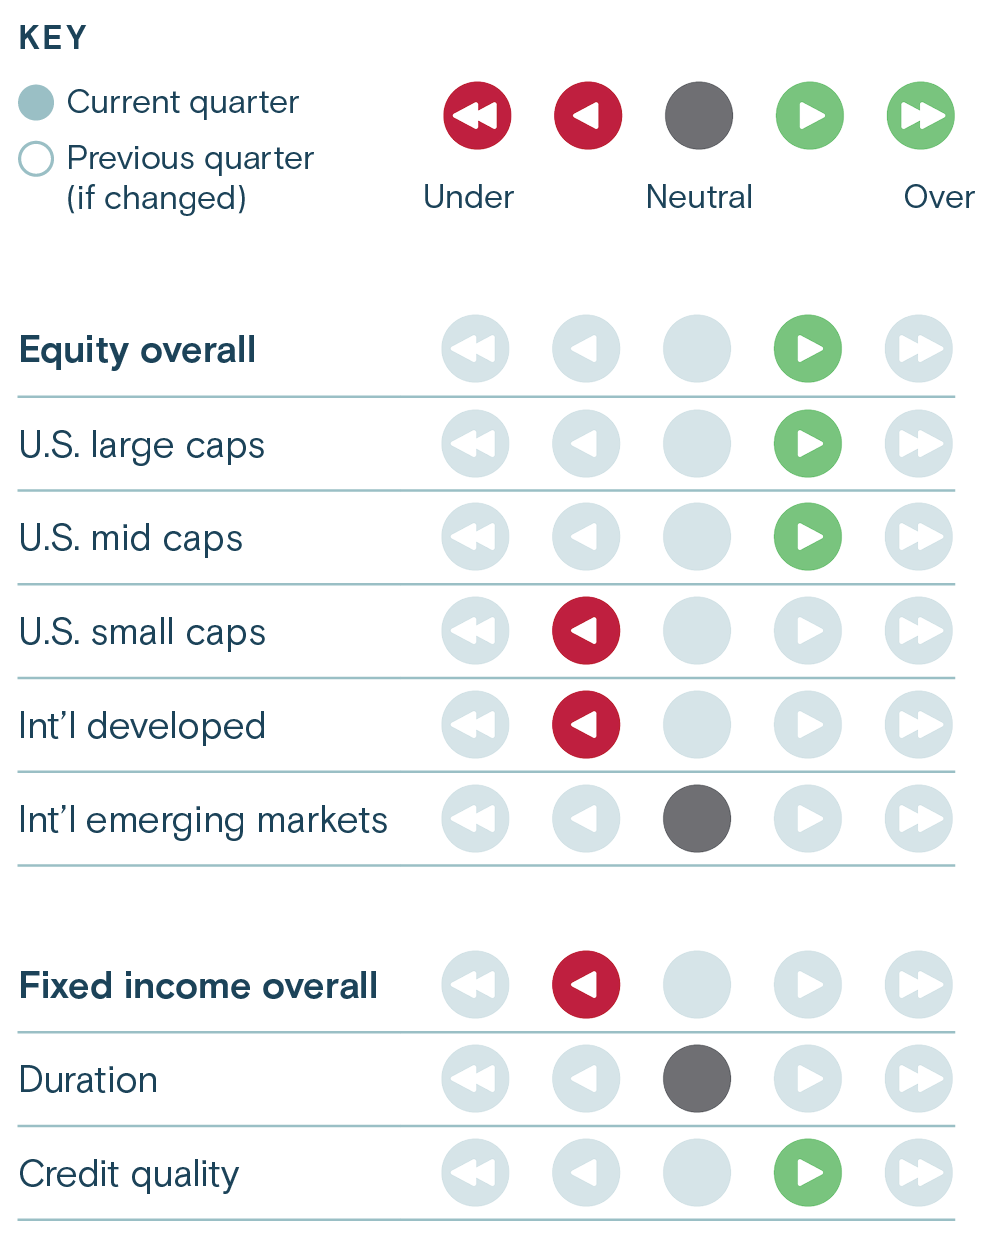
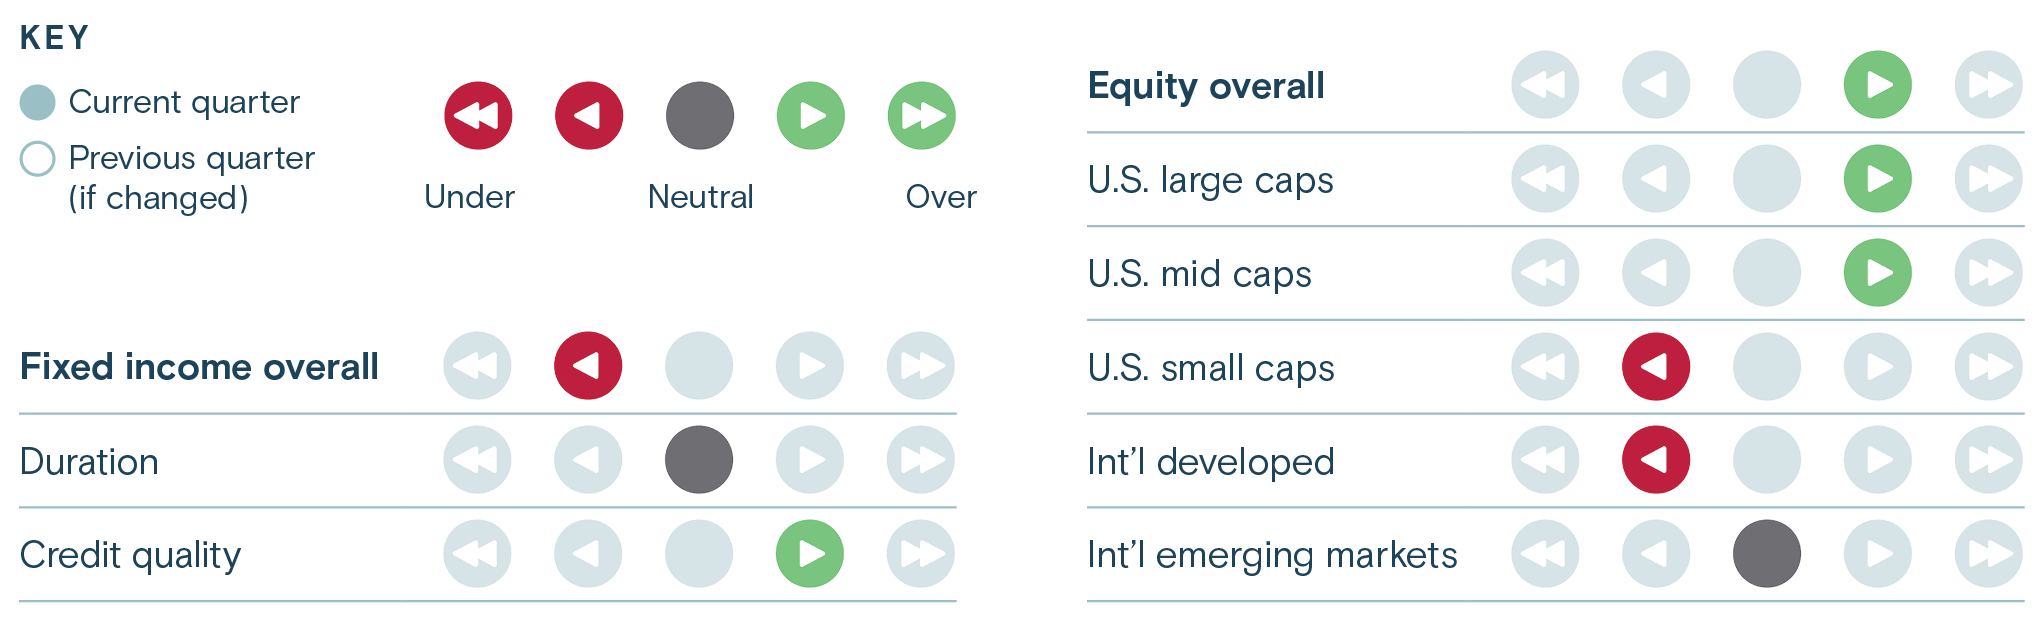
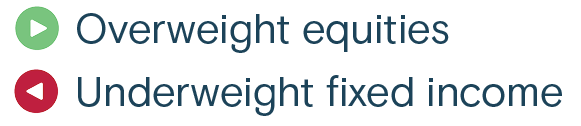
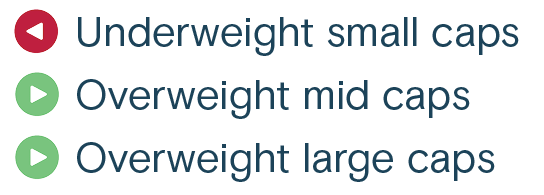
Given our broadly constructive outlook, we continue to recommend maintaining exposure to U.S. equities, favoring an overweight to large-cap stocks and a moderate overweight to mid-cap stocks as we expect continued strength to broaden. In fixed income, we expect modest flattening of the yield curve, favoring longer-dated Treasury securities and higher-quality corporate bonds. Investment-grade corporate bond spreads (the yield paid over comparable Treasuries) are relatively narrow, but as their absolute yields remain attractive, we expect continued demand.
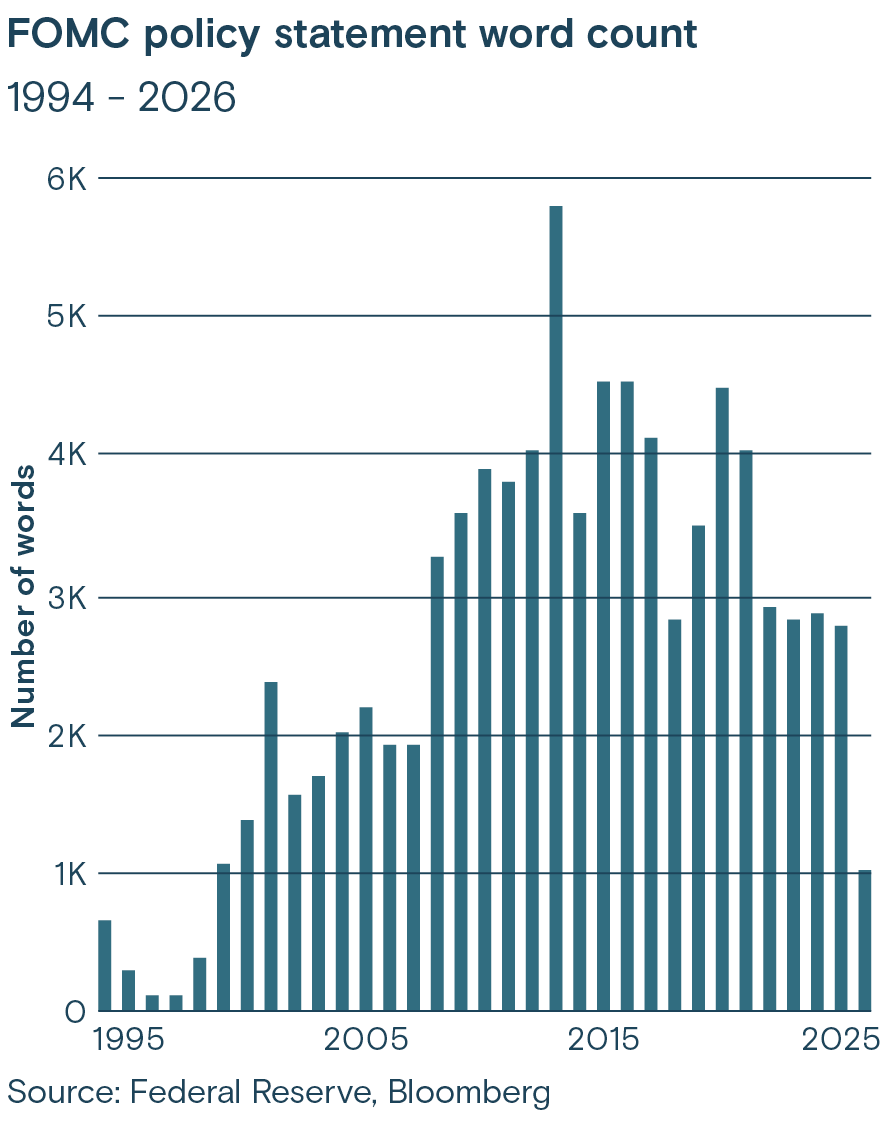
Kevin Warsh, the chair of the U.S. Federal Reserve (Fed), has been clear the Fed will offer less guidance on the expected future path of the Federal Funds rate. Both the first policy statement and the first press conference under Chair Walsh were brief and lacked clear guidance on Fed policy. One likely result of less communication is more volatility in the market’s assessment of the future path of the Fed Funds rate. This could in turn result in higher volatility in the U.S. Treasury market overall.
Volatility in the 2-year Treasury, which is very sensitive to the Fed Funds rate, steadily declined from Alan Greenspan’s tenure as Fed chair (1987-2006) through Jay Powell’s tenure, until volatility spiked with COVID-19 in 2020.
A key reason why volatility fell was increased forward guidance on the expected path of the Fed Funds rate in the wake of the financial crisis. The Fed communicated more, including the introduction of the so-called “dot plot” chart that detailed forward estimates from each member of the Fed’s rate-setting committee. The dot plot, which the market often watches very closely, also may be a casualty of more spartan Fed communication.
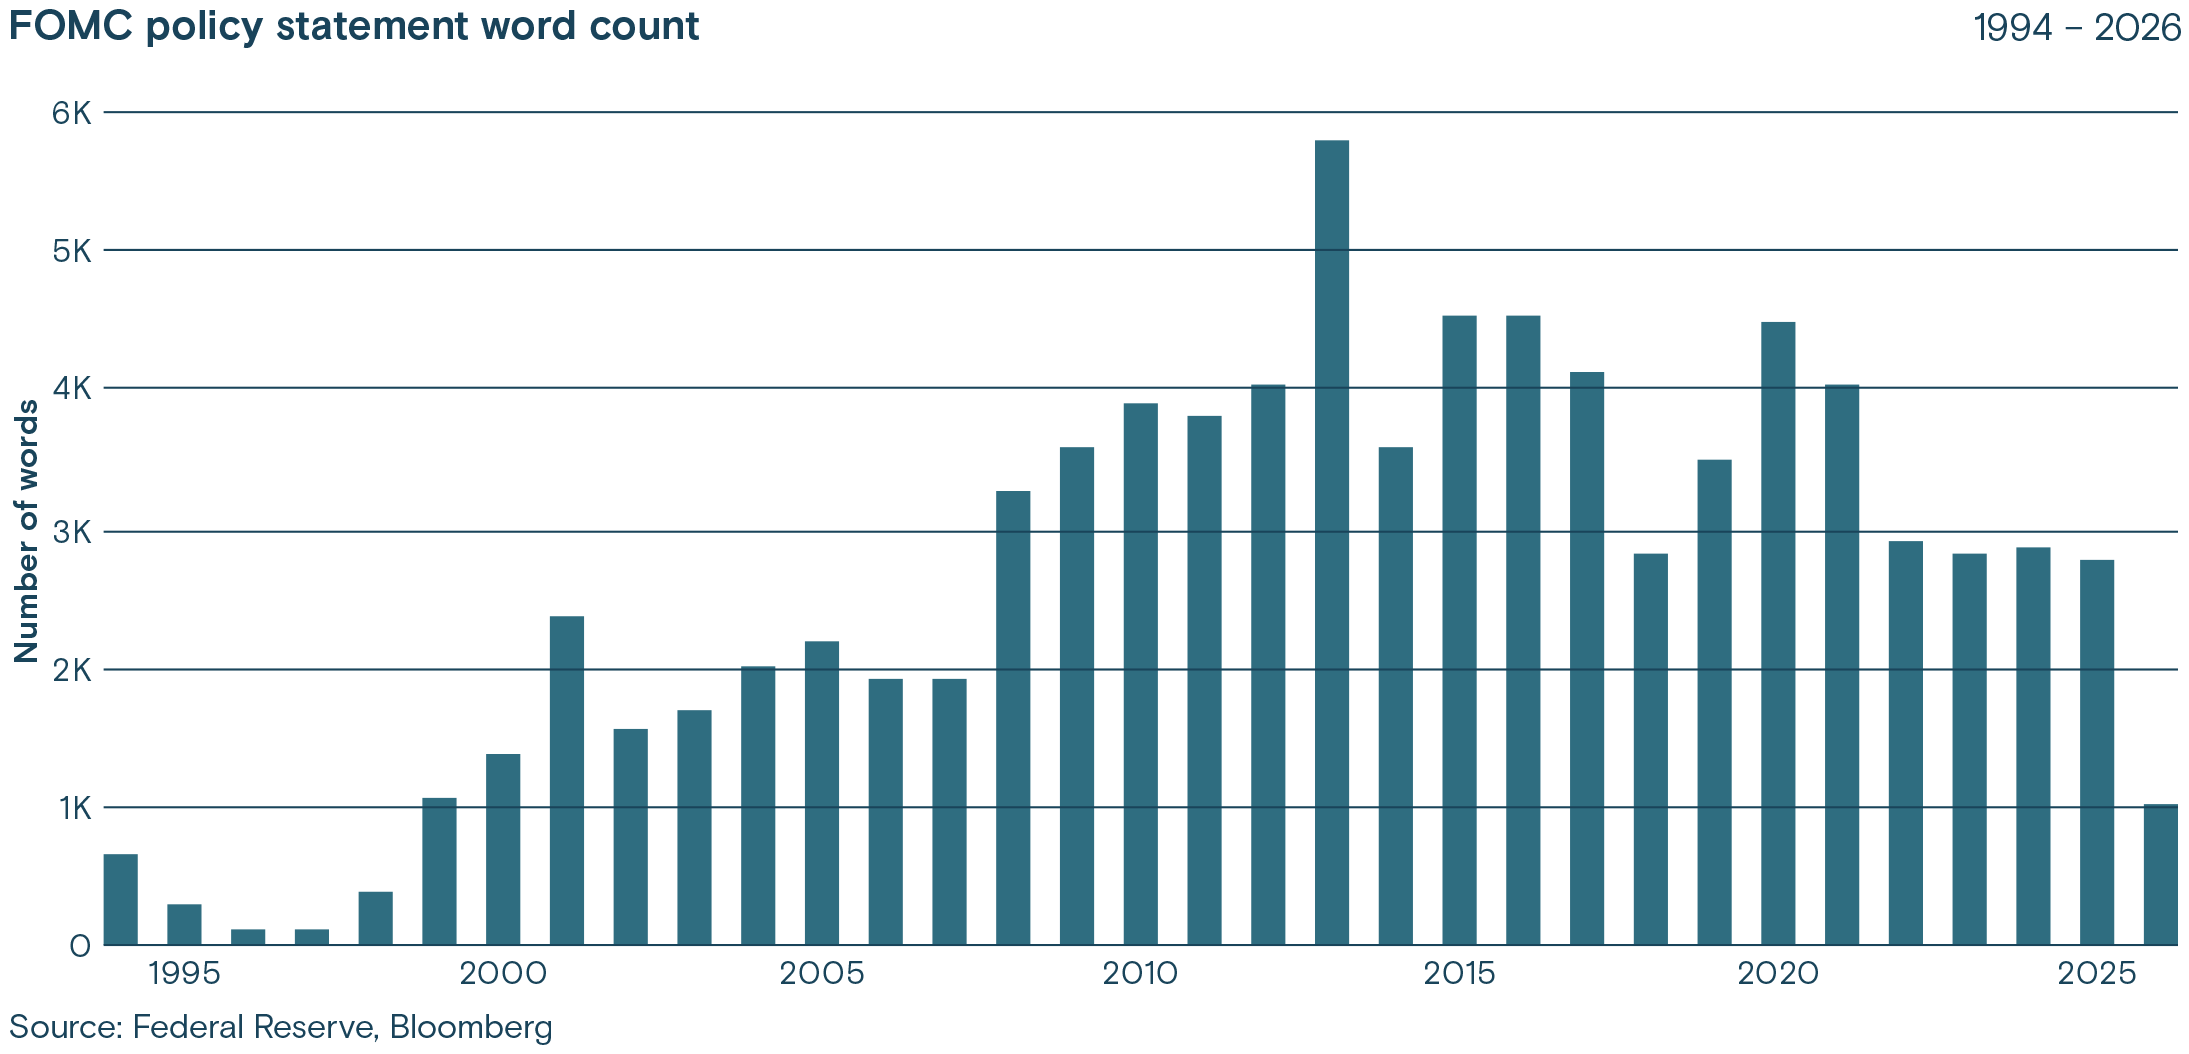
The word count of the first policy statement under Chair Warsh fell significantly versus previous FOMC statements. We may also see Fed committee members and regional presidents be cautious in their public statements. This shift in communications means market participants would have to make do with less information and do more work and develop their own views of where the Fed Funds rate will be based on broader economic and market data.
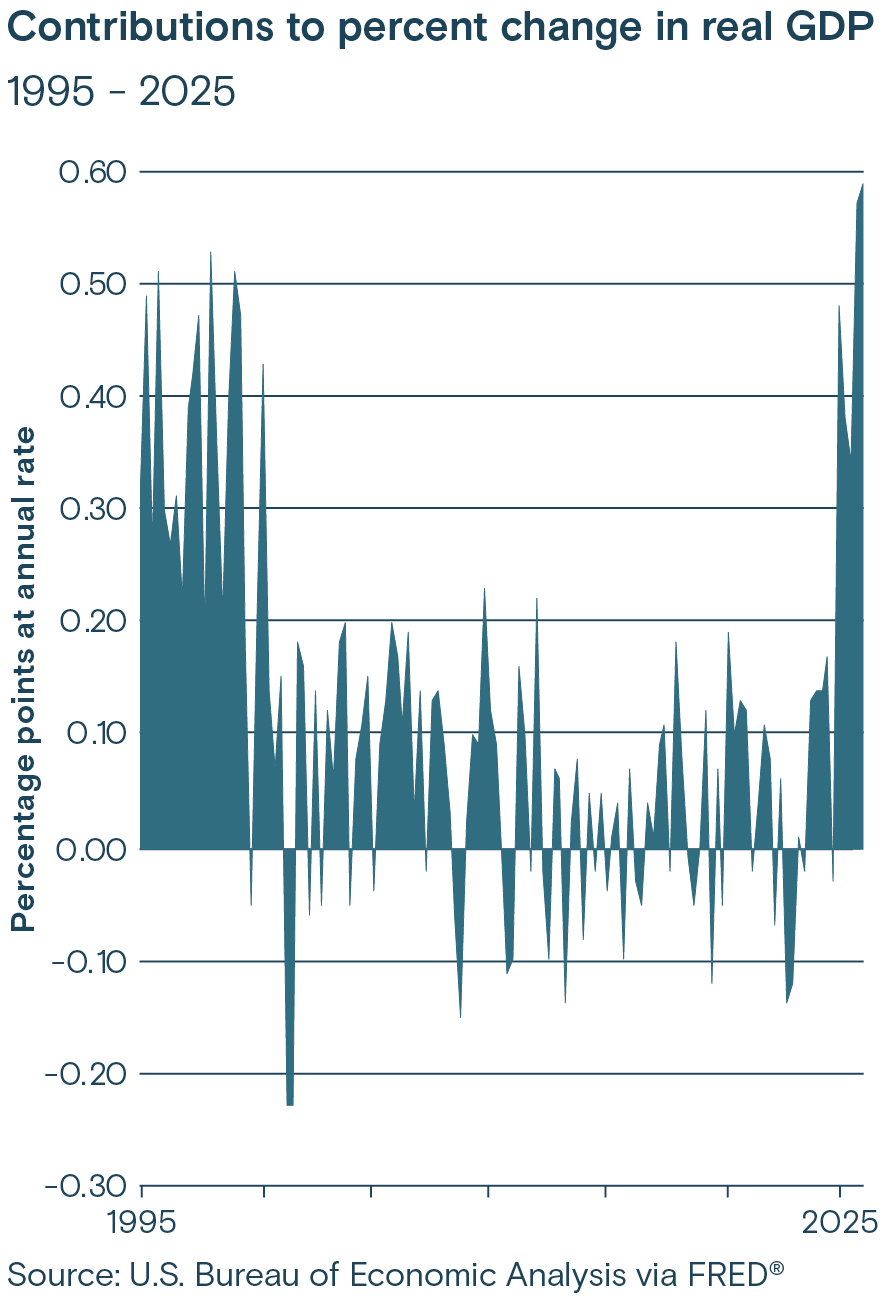
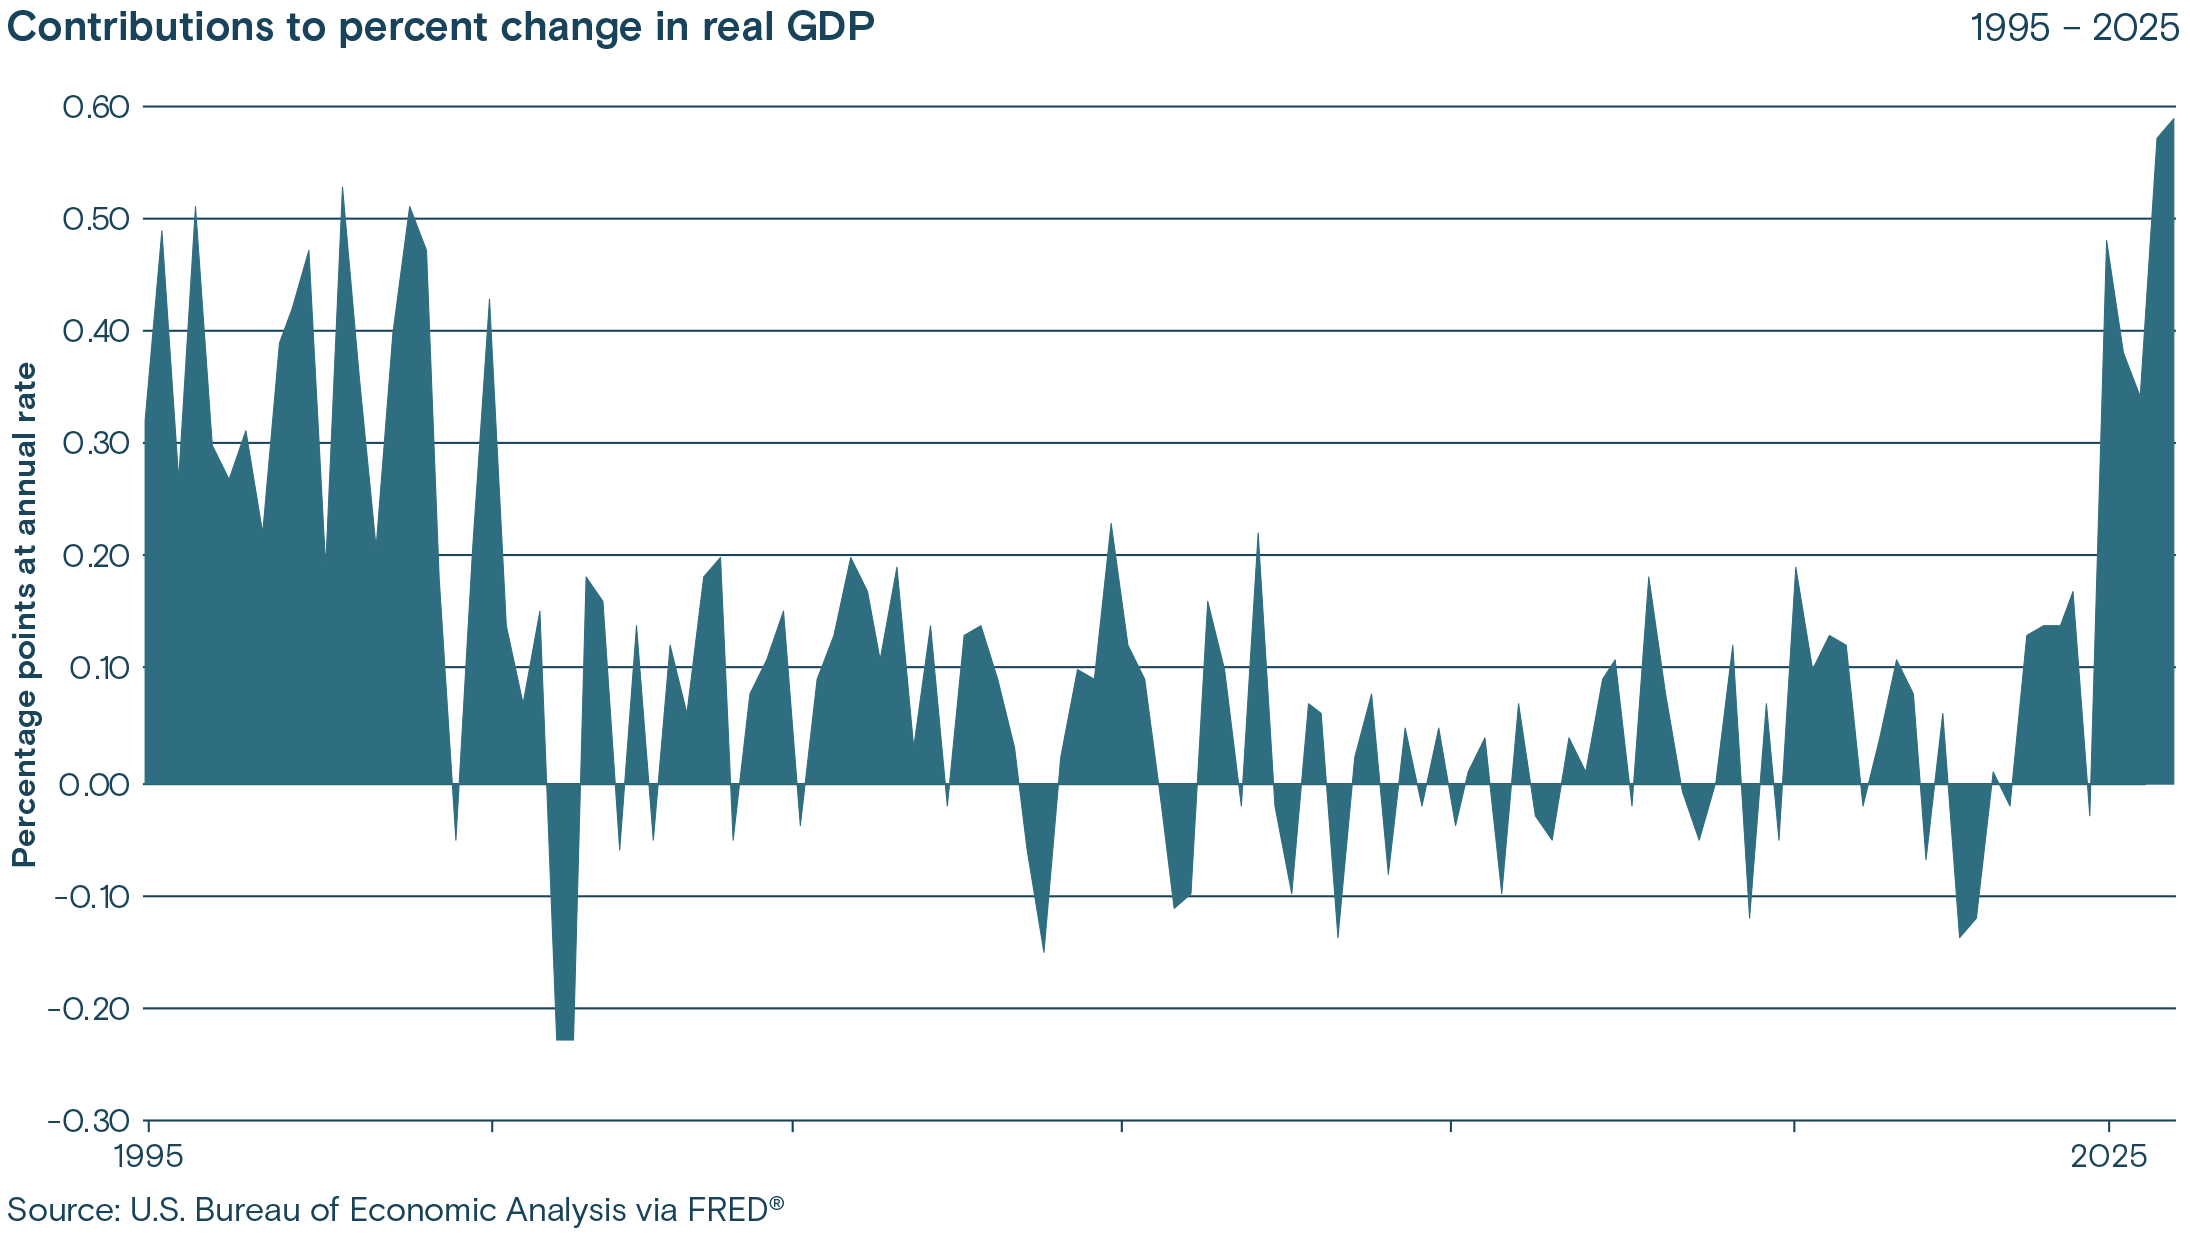
Capital spending, especially in AI-related companies, has provided a large tailwind to U.S. economic growth. Estimates of 2026 capital spending related to AI are as high as nearly 2% of U.S. GDP. This includes software, research and development, semiconductors, data centers, manufacturing facilities and other equipment.
AI leaders plan to ramp up future spending even higher. AI-related capital spending through 2030 could reach $5.5 trillion dollars, according to some Wall Street estimates. The insatiable demand for semiconductors, data centers and equipment also is driving up prices, fueling inflation in electronic components. Most of this capital spending has previously been financed out of operating cash flows.
This is changing, however, as capital spending begins to erode free cash flow. As a result, the so-called “hyperscalers” (Microsoft, Google, Meta, Amazon and Oracle) have started to tap debt markets to fund their expansion, increasing balance sheet leverage in the process. Hyperscaler balance sheets generally remain solid. For example, credit default swaps prices (a market-based indicator of default risk) on Oracle have increased significantly. So far, however, debt markets have absorbed the surge in debt issuance but are closely watching leverage and whether the hyperscalers will be able produce enough AI revenue and earnings to justify the heavy capital spending.
The S&P 500® Index returns and earnings have been driven much of the past year by the mega-cap technology stocks. The top 10 stocks by market capitalization, which are largely technology names, have accounted for around 40% of the S&P 500’s market capitalization. Technology stocks also have driven strong earnings. S&P 500 earnings grew about 20% in the first quarter. Without technology stocks, earnings growth would have been roughly cut in half.
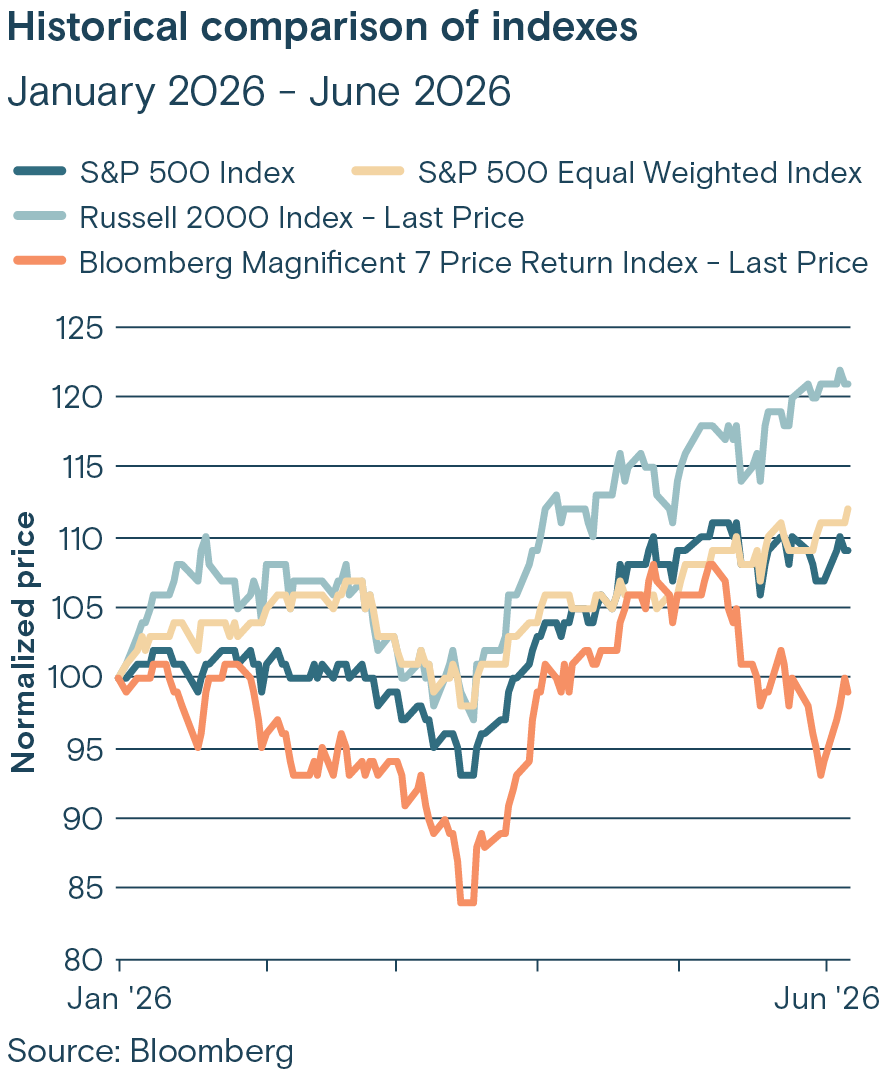
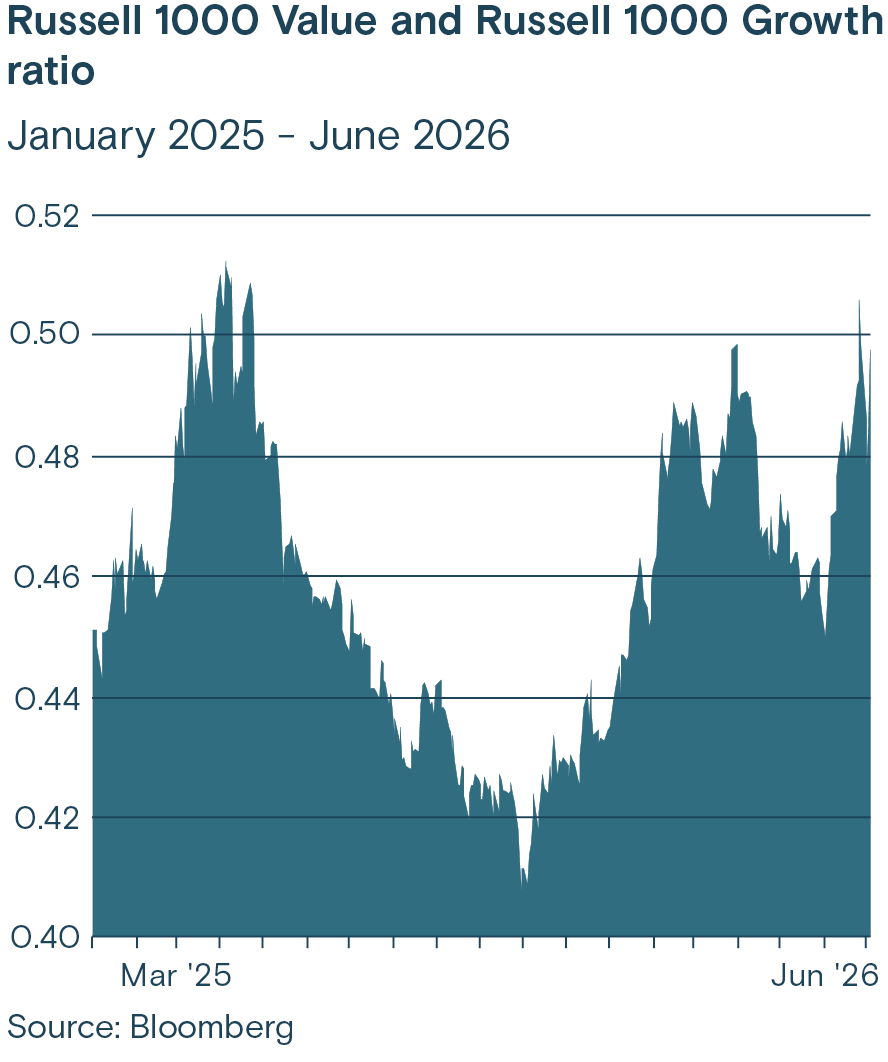
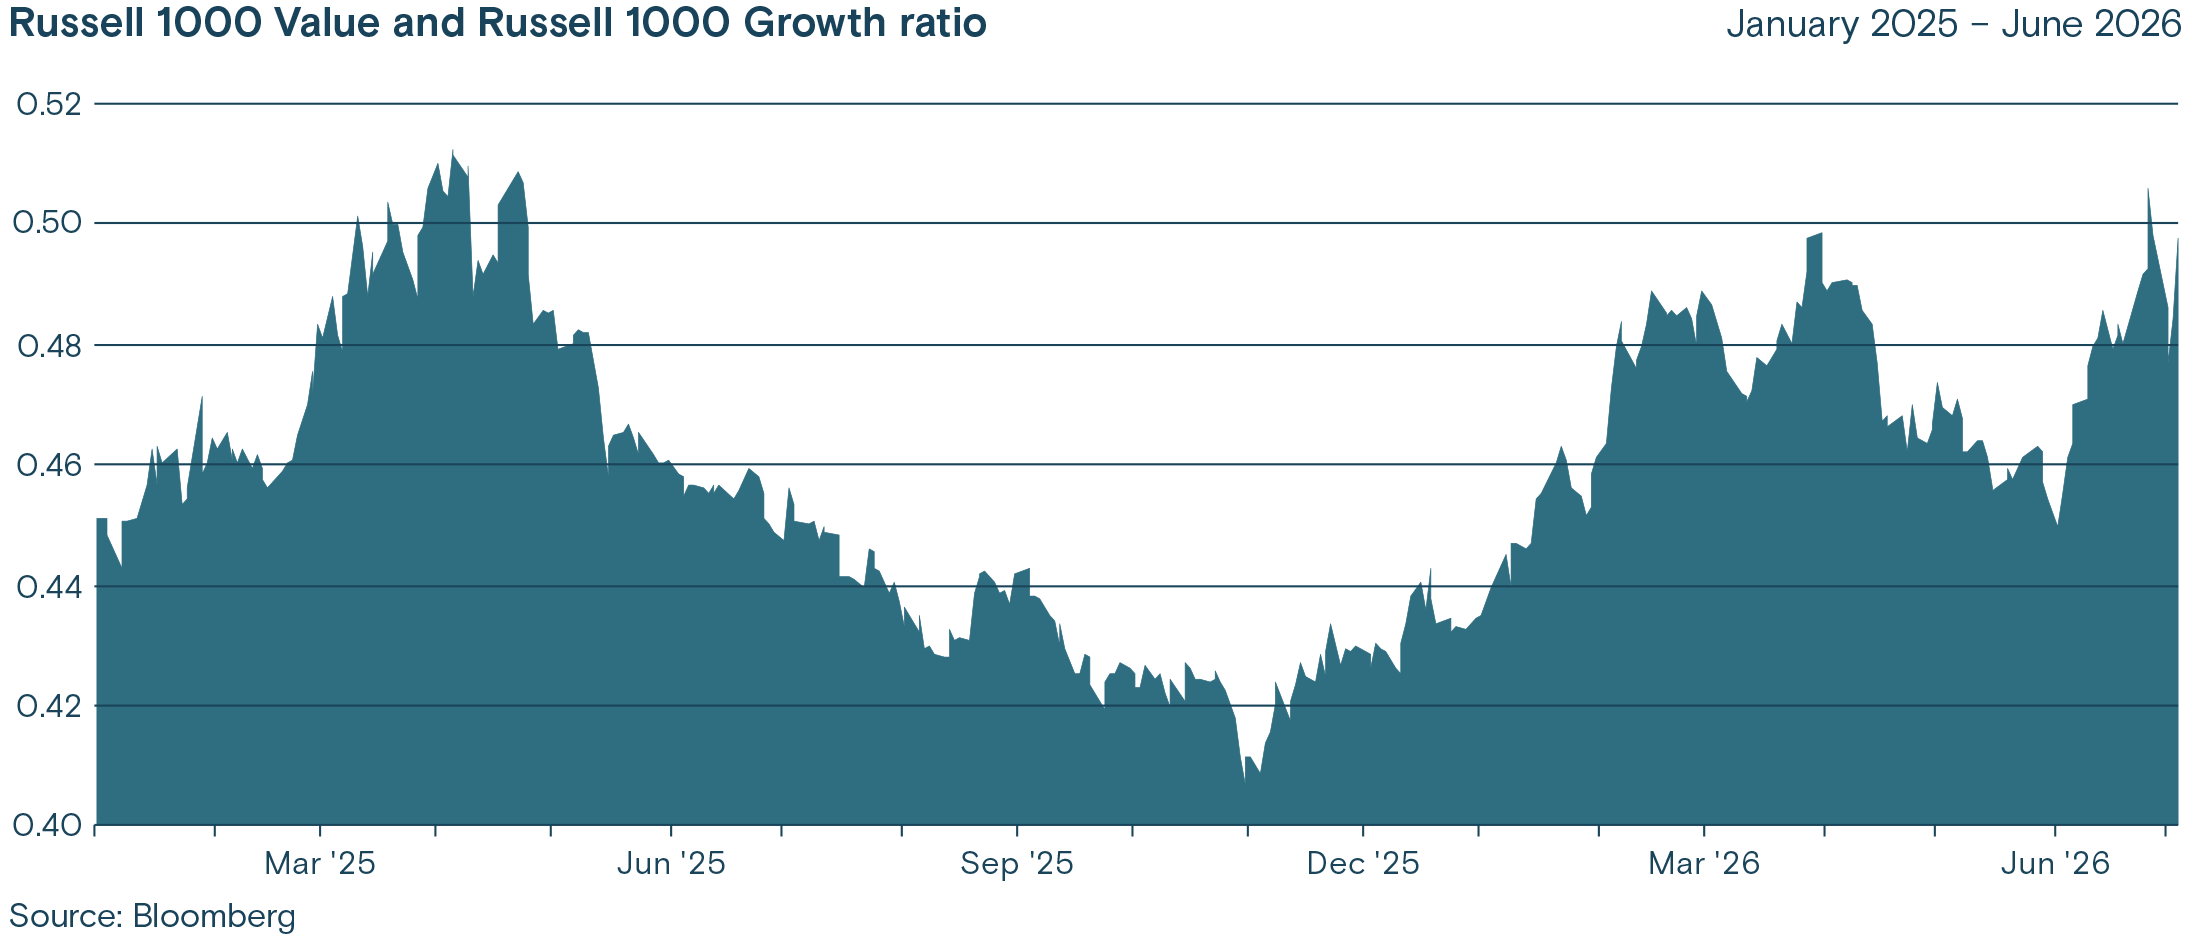
Markets, however, have started broadening beyond large-cap technology. Earnings expectations are increasing for small-cap and mid-cap companies. The performance of value stocks has also improved as investors seek to diversify away from artificial intelligence leaders due to concerns over high valuations. Additionally, the equal-weighted S&P 500 index also has started to outperform the market-cap weighted index. This broadening has been supported by better than expected economic growth, with data surprising to the upside.
We expect broadening to continue as investors seek to diversify away from concentration in a handful of mega-capitalization stocks.
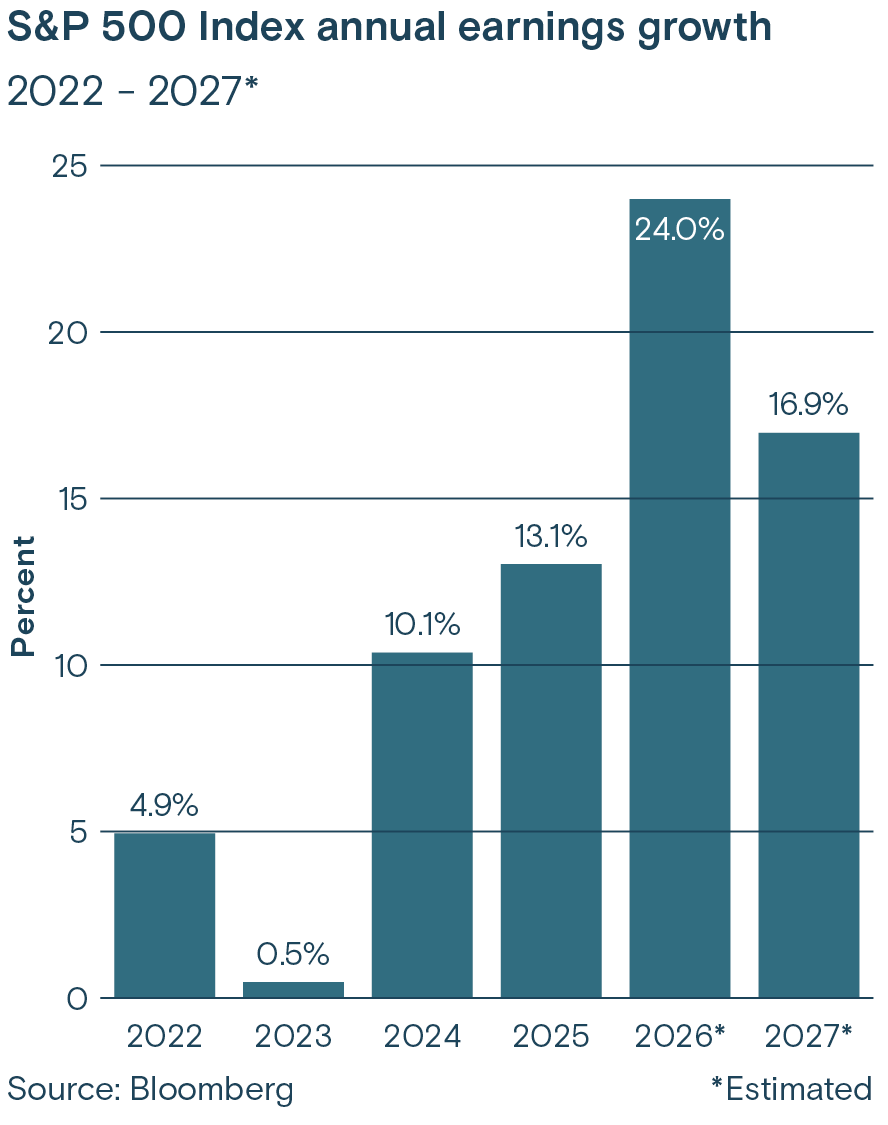
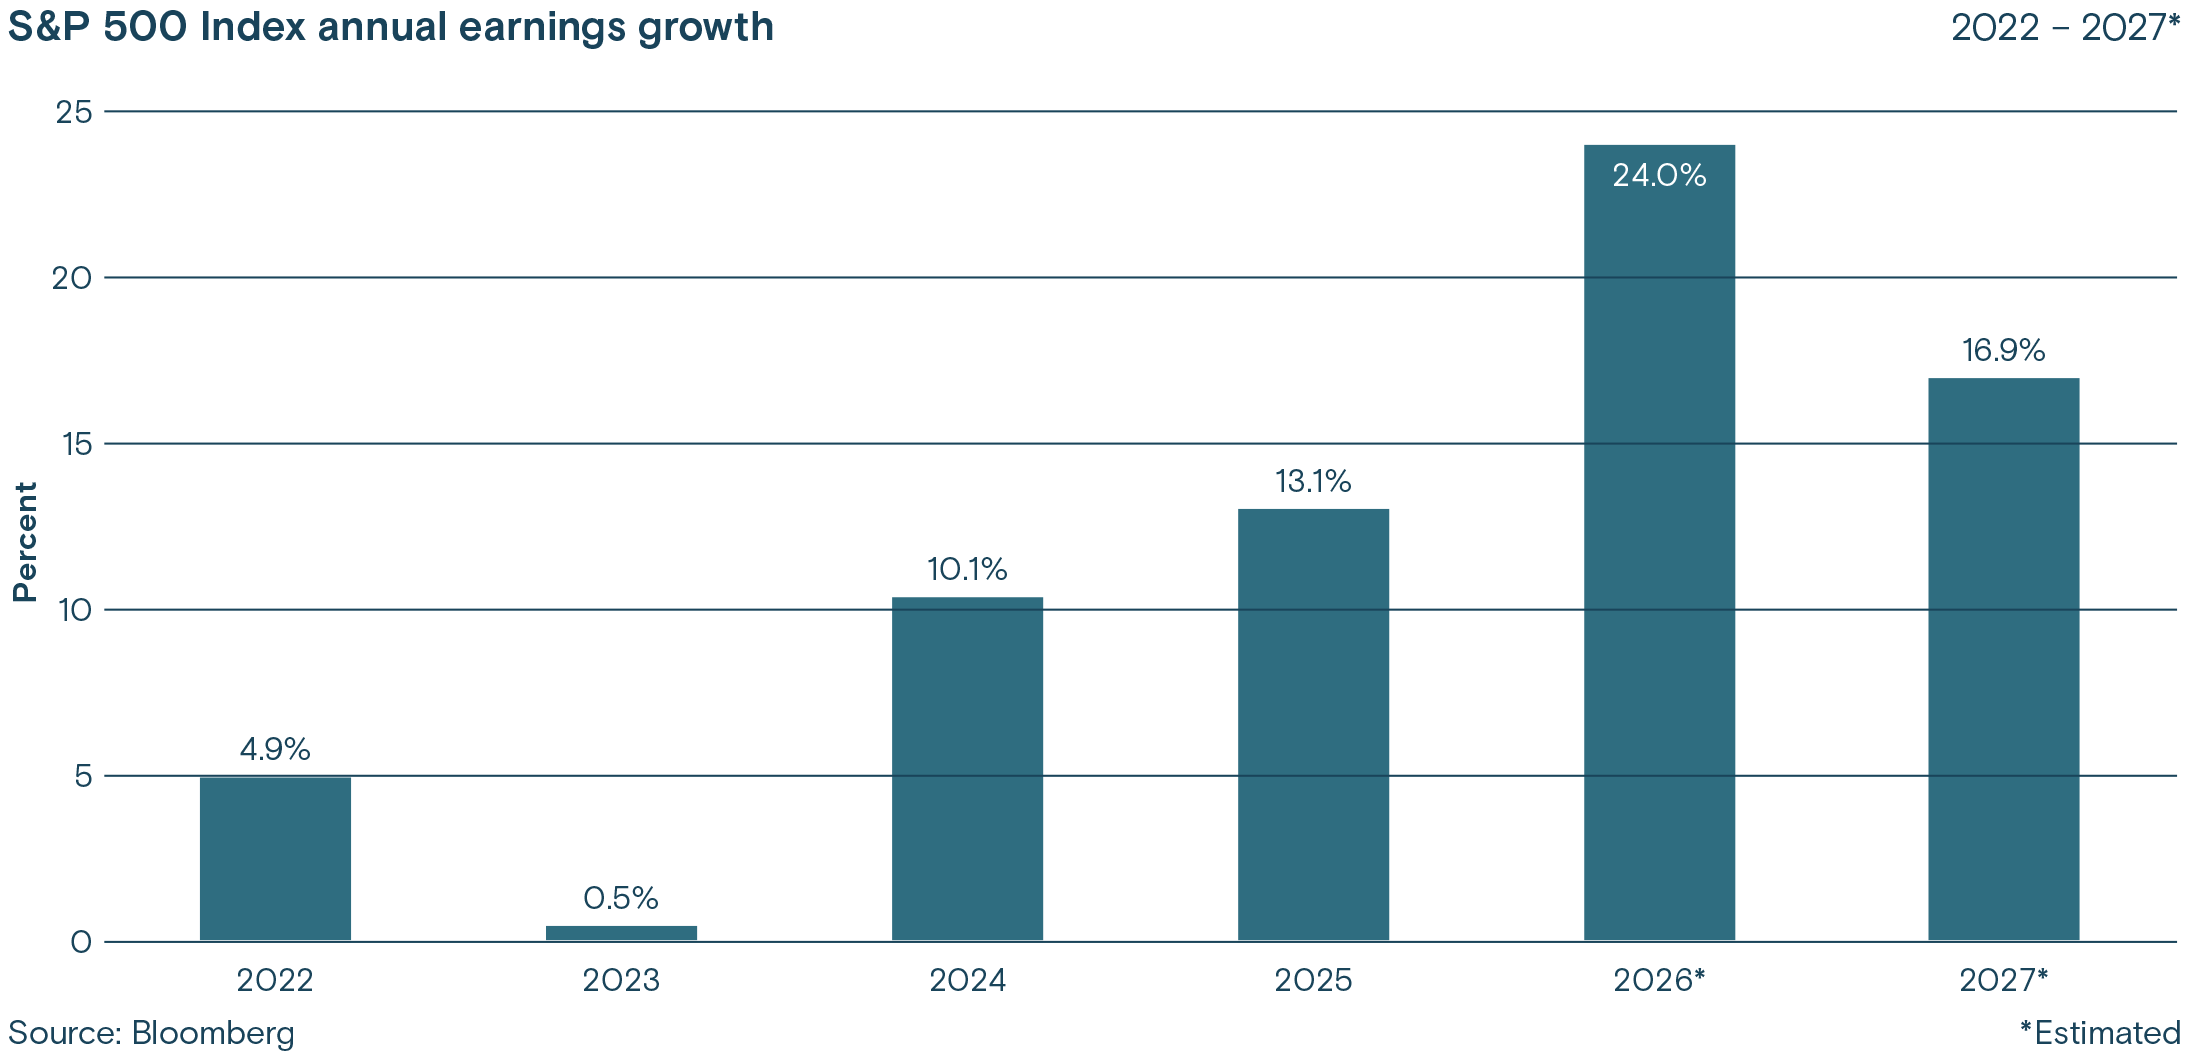
Strong earnings have been a key positive driver of equity markets this year. Solid economic growth and the AI boom have fueled earnings growth. Second quarter earnings are expected to grow 23% year over year on 12% growth in sales, resulting in expanding profitability and margins. The robust pace of earnings also is expected to continue through 2026 and into 2027, with estimates of 24% and 17% growth.
Much of the growth has been driven by mega-cap technology and AI stocks. For example, in the first quarter the so-called Magnificent 7 grew earnings by 63%, versus 17% for the other 493 stocks in the S&P 500. Solid earnings growth, however, is broadening beyond large-cap growth into small caps and value stocks. One impact of stronger earnings growth is that it mitigates rich valuations, such as the widely watched price to earnings ratio (P/E).
Micron Technology offers a good example of this phenomenon. After Micron reported better than expected Q1 earnings and raised guidance on forward earnings, its stock rose nearly 16%. Normally, a price jump of that magnitude would dramatically increase the P/E ratio, but forward earnings expectations increased sharply. The result was a lower valuation multiple, not a higher one.
We expect continued solid earnings growth into the third quarter, supporting equity markets. Over time, earnings drive equity markets.
Capital Markets Perspective: A look ahead
Want a digital copy of our Capital Markets Perspective to take with you and share with clients?
Media contact: Callie Briese, 612-844-7340; callie.briese@thrivent.com
All information and representations herein are as of 07/08/2026, unless otherwise noted.
The views expressed are as of the date given, may change as market or other conditions change, and may differ from views expressed by other Thrivent Asset Management, LLC associates. Actual investment decisions made by Thrivent Asset Management, LLC will not necessarily reflect the views expressed. This information should not be considered investment advice or a recommendation of any particular security, strategy or product. Investment decisions should always be made based on an investor's specific financial needs, objectives, goals, time horizon, and risk tolerance.
Any indexes shown are unmanaged and do not reflect the typical costs of investing. Investors cannot invest directly in an index.
Past performance is not necessarily indicative of future results.