![2026 Q4 Market Outlook [PODCAST]](/content/dam/thrivent/fp/fp-insights/advisors-market360-podcast/advisors-market360-podcast-16x9-branding-insights-card.jpg/_jcr_content/renditions/cq5dam.web.1280.1280.jpeg)
2026 Q4 Market Outlook [PODCAST]
2026 Q4 Market Outlook [PODCAST]
How will recent events affect overall positioning for the remainder of the year?
How will recent events affect overall positioning for the remainder of the year?
09/29/2026
FUND COMMENTARY

Mid-cap equities—generally companies with market capitalizations between approximately $7 billion and $35 billion—occupy a unique position within the U.S. equity market. Often overshadowed by the scale of large-cap companies and the growth narratives surrounding small caps, mid-cap firms can offer a compelling combination of growth potential, business maturity and attractive valuations.
Mid-cap companies often represent businesses that have successfully moved beyond their early growth stages but still have meaningful opportunities to expand market share, increase profitability and grow earnings. This combination of established operations and ongoing growth potential can make mid-caps an appealing middle ground between large- and small-cap investments.
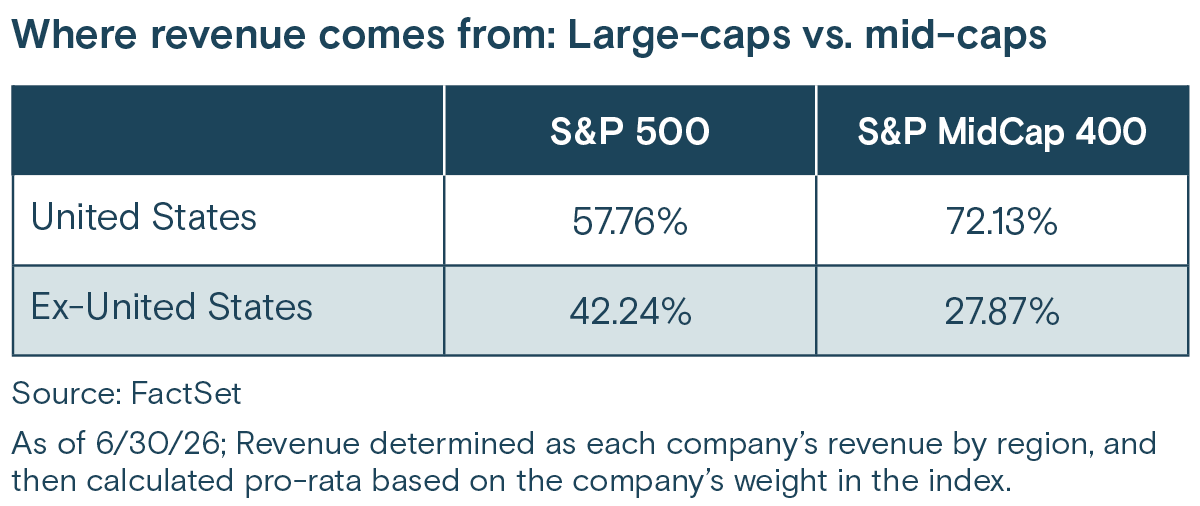
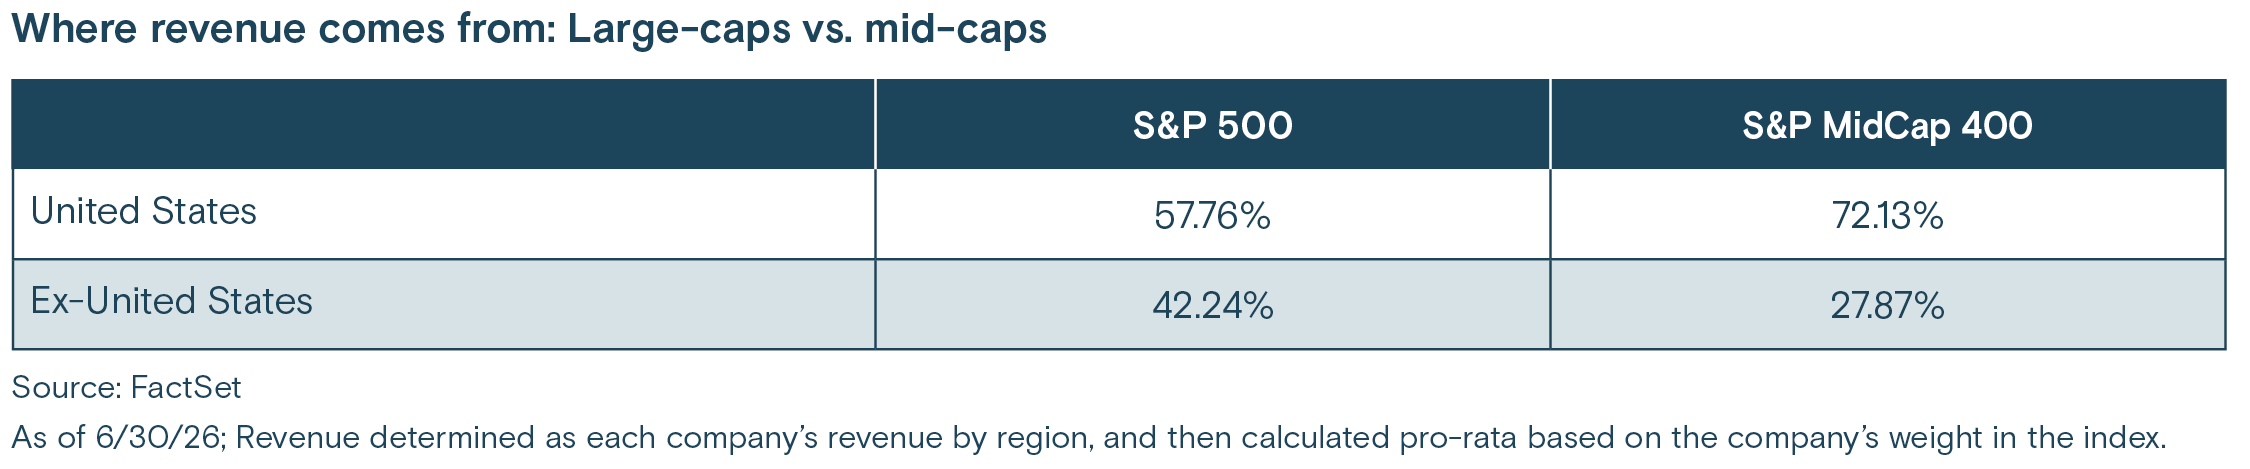
For clients with a preference for domestic market exposure, mid-cap equities may offer an additional benefit. While many large-cap companies derive a significant portion of their revenues from international markets, U.S. mid-cap companies tend to generate a larger share of their revenues domestically, potentially providing more direct exposure to the U.S. economy.
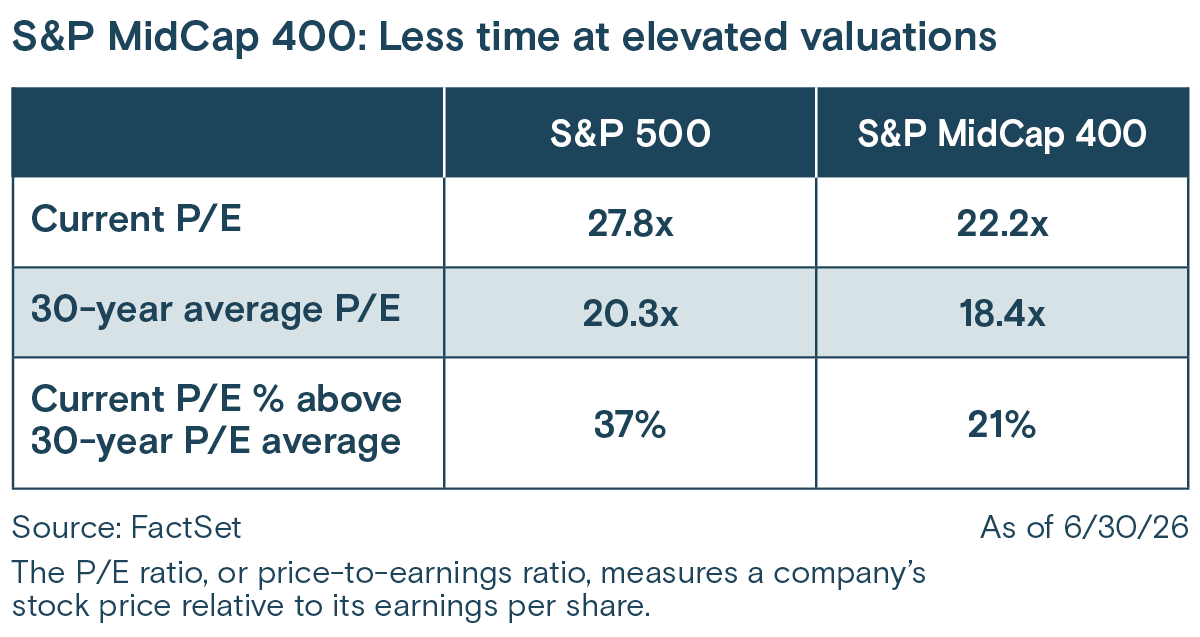
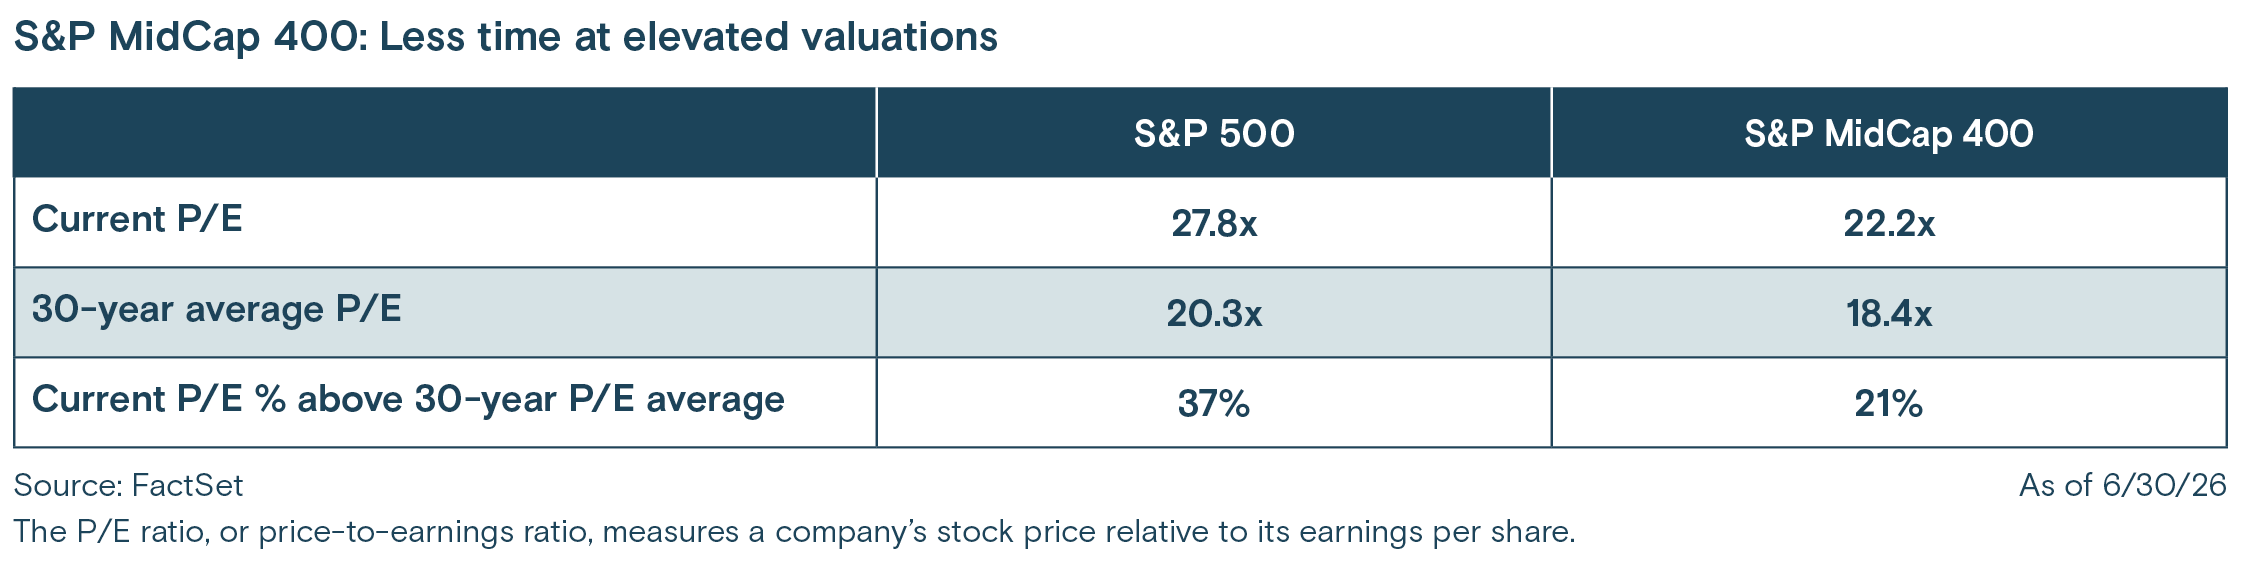
Small- and mid-cap equities have historically traded at valuation discounts relative to their large-cap counterparts, offering investors opportunities to access high-quality businesses at more attractive prices. While equity valuations across all market sizes are generally above long-term averages, mid-cap equity valuations are at less of a premium to their historic average than large cap equity valuations are. As a result, reasonable valuation is one factor that may influence long-term returns.
For investors with a long-term perspective, the combination of attractive valuations and ongoing business growth potential may create a compelling investment opportunity.
Recent market leadership has been concentrated in a handful of large-cap companies, particularly within the technology sector. However, market leadership can shift over time, and mid-cap equities have historically demonstrated the ability to provide an attractive balance of risk and return relative to both large- and small-cap stocks. Over rolling 10-year periods since November 2004, mid-cap stocks have outperformed large-cap stocks 68% of the time and small-cap stocks 99% of the time.
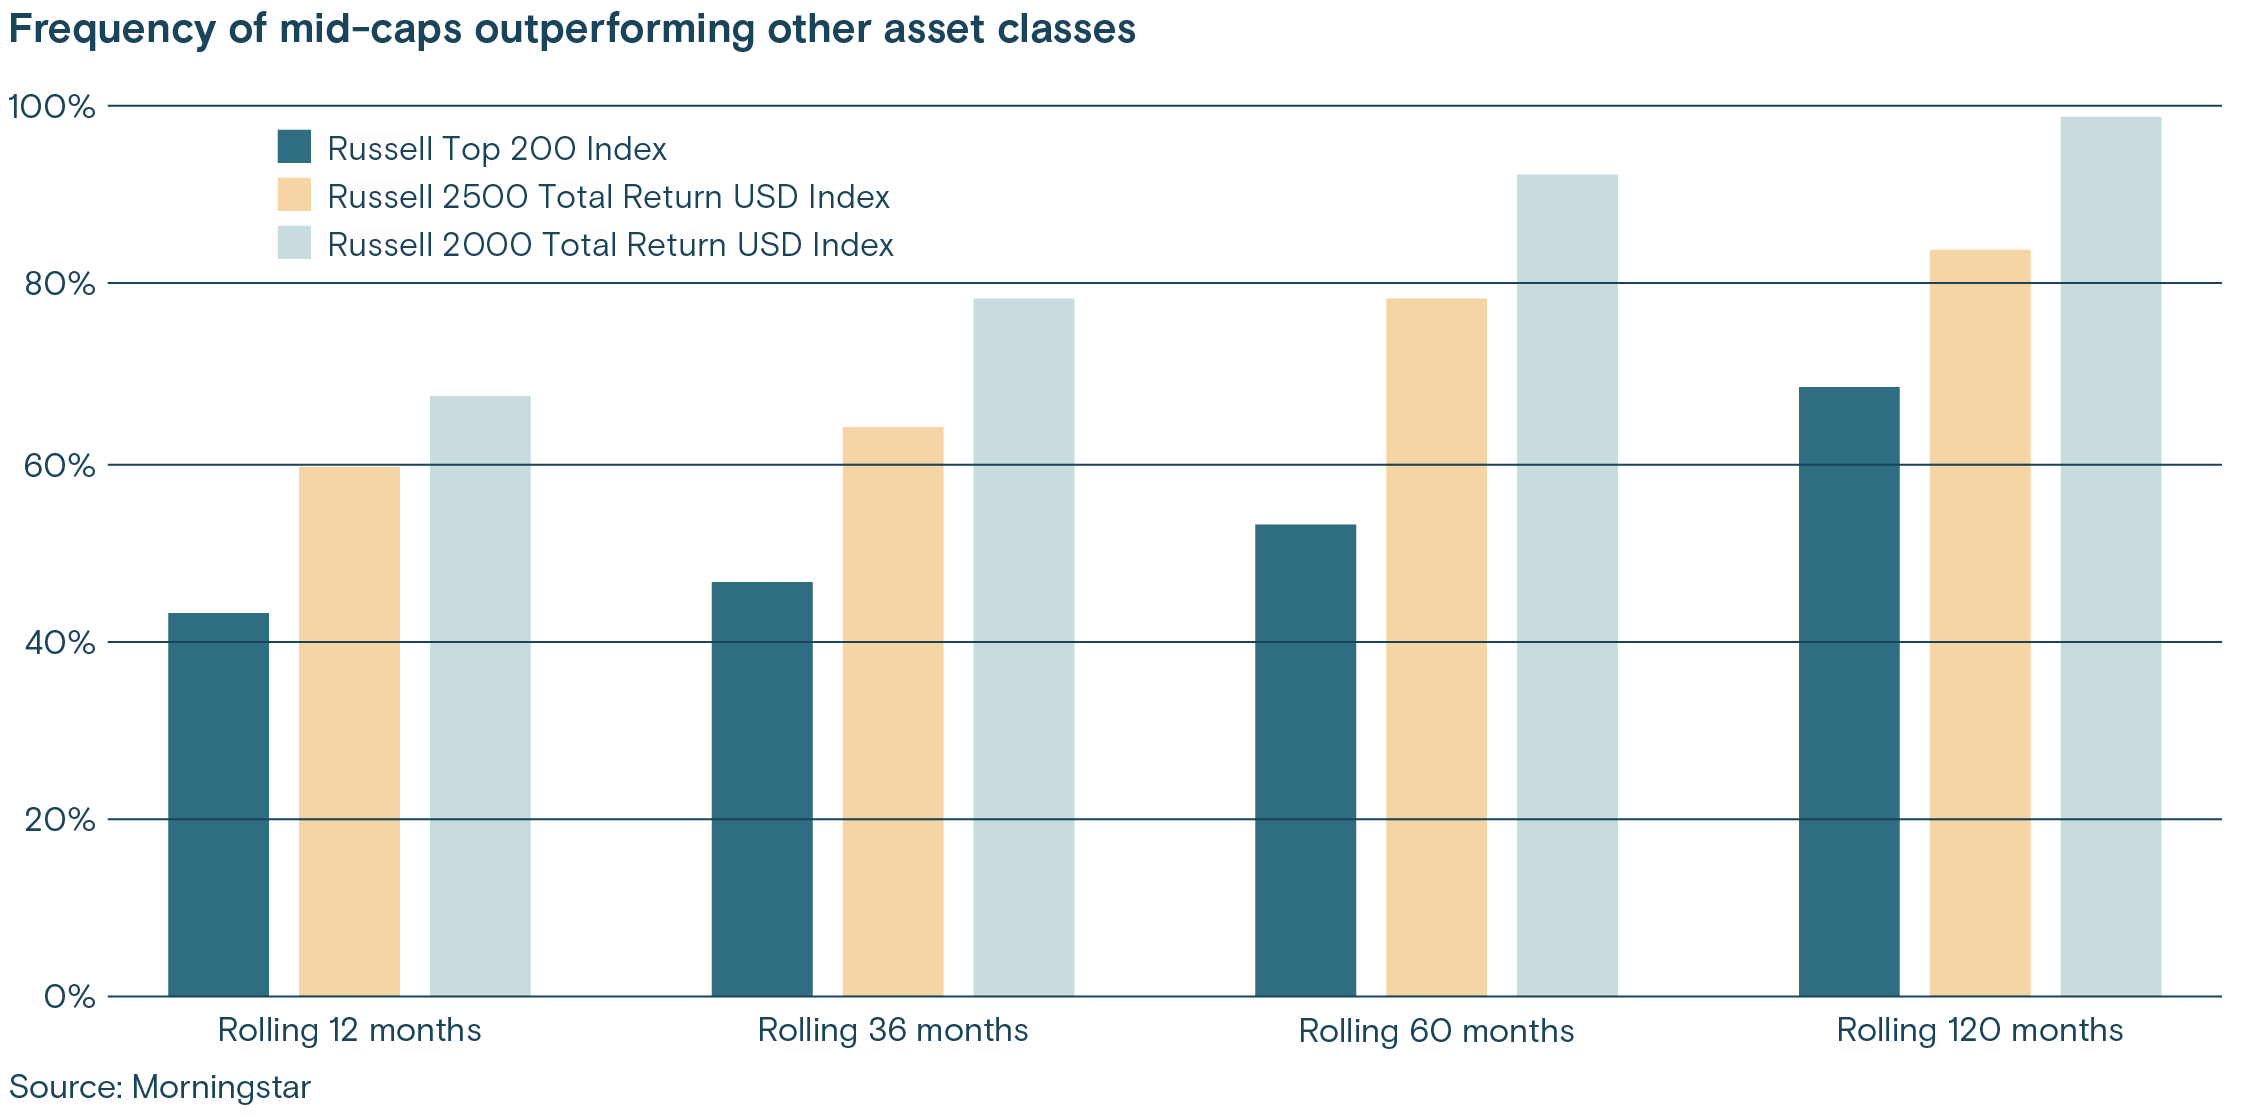
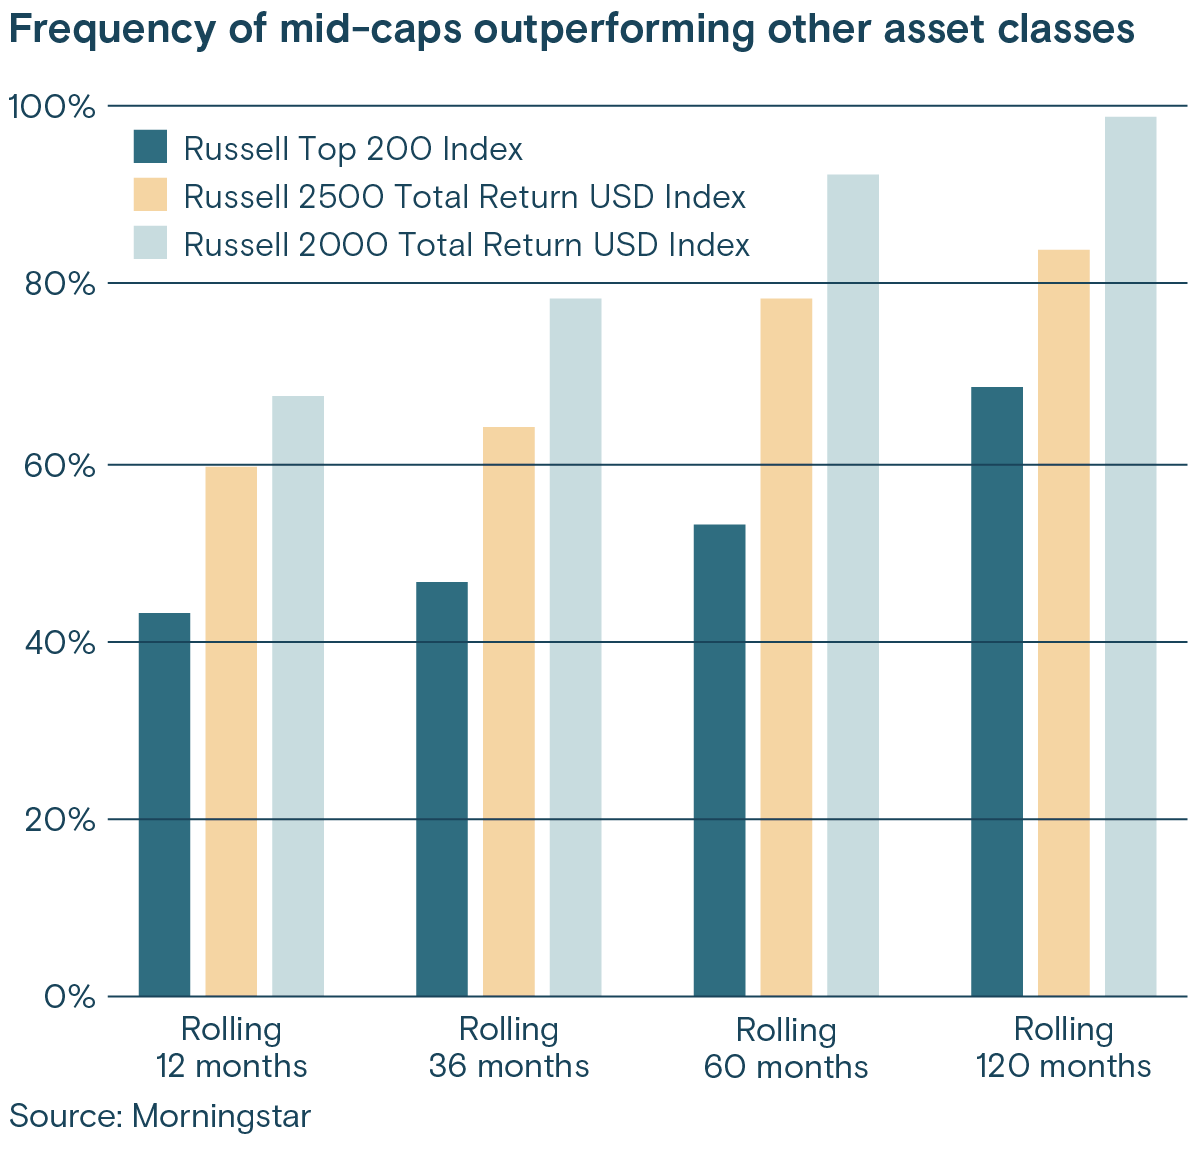
Mid-cap companies have often benefited from greater growth potential than large caps while exhibiting more operational stability than many smaller companies. Historically, their performance has been less dependent on a specific phase of the economic cycle, allowing them to participate in a variety of market environments. In addition, historical market data has shown periods in which domestic mid-cap equities have outperformed broader global equity benchmarks, highlighting the potential benefits of U.S.-focused exposure.
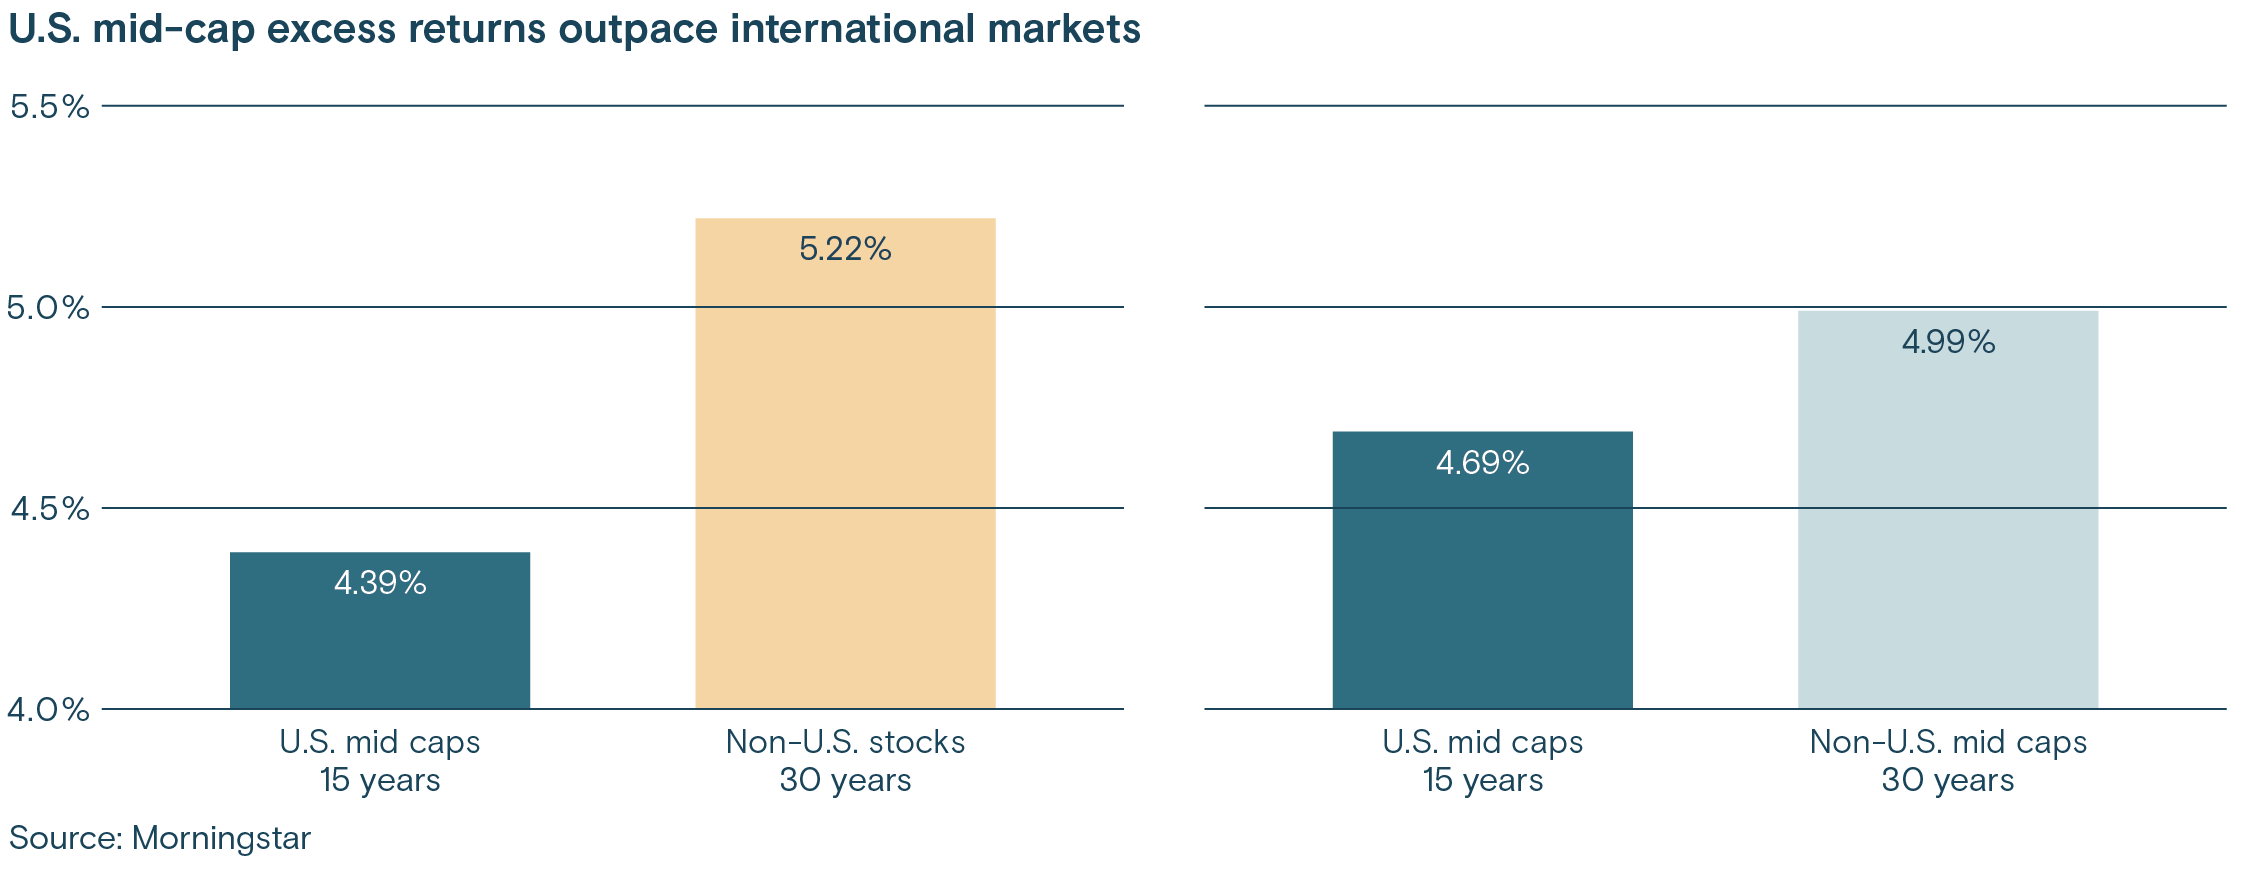
The S&P MidCap 400 Index was compared against MSCI World ex USA Index for non-U.S. stocks and against MSCI World ex USA Mid Cap Index for non-U.S. mid caps.
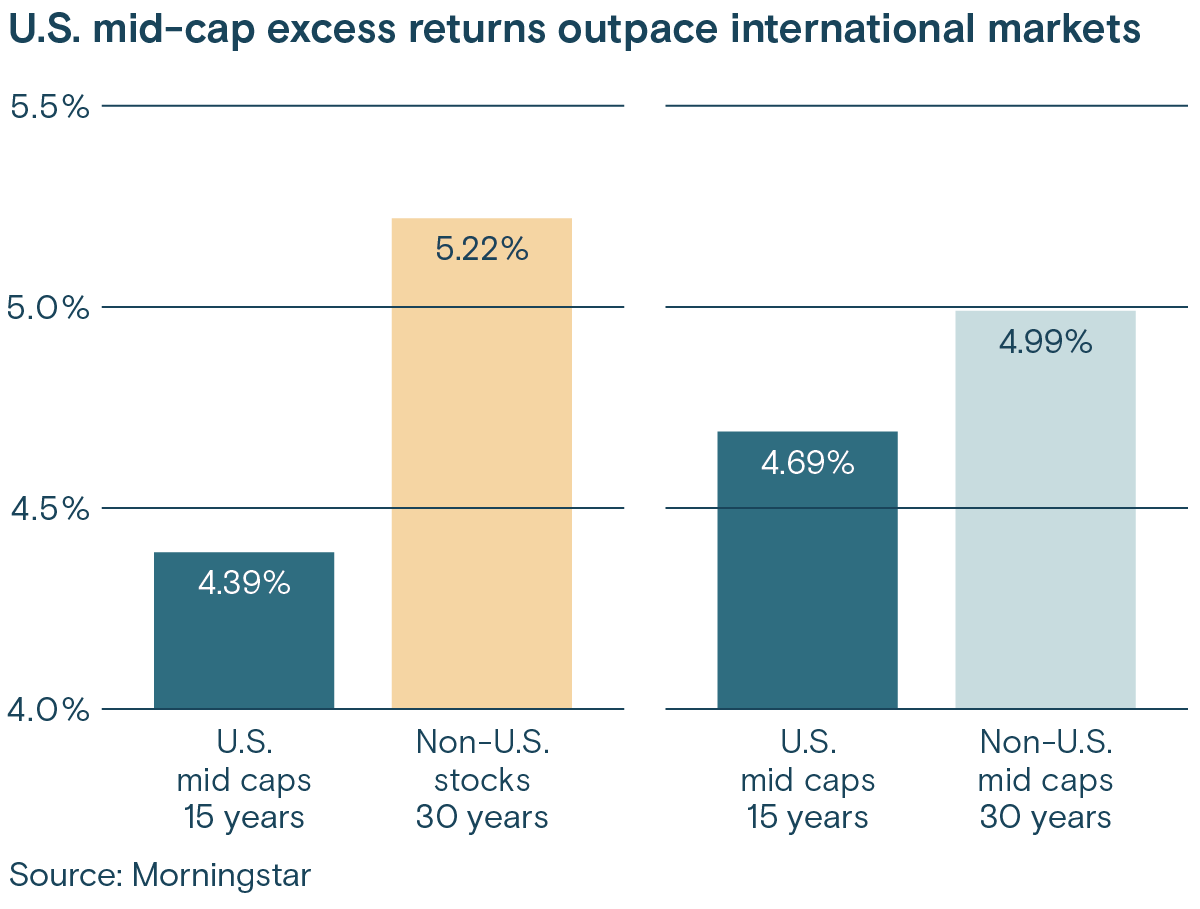
The S&P MidCap 400 Index was compared against MSCI World ex USA Index for non-U.S. stocks and against MSCI World ex USA Mid Cap Index for non-U.S. mid caps.
As companies mature, they often develop characteristics associated with higher-quality businesses, including experienced management teams, established business models, demonstrated profitability and stronger balance sheets. Mid-cap companies frequently exhibit many of these attributes while retaining the ability to grow at a faster pace than their large-cap counterparts.
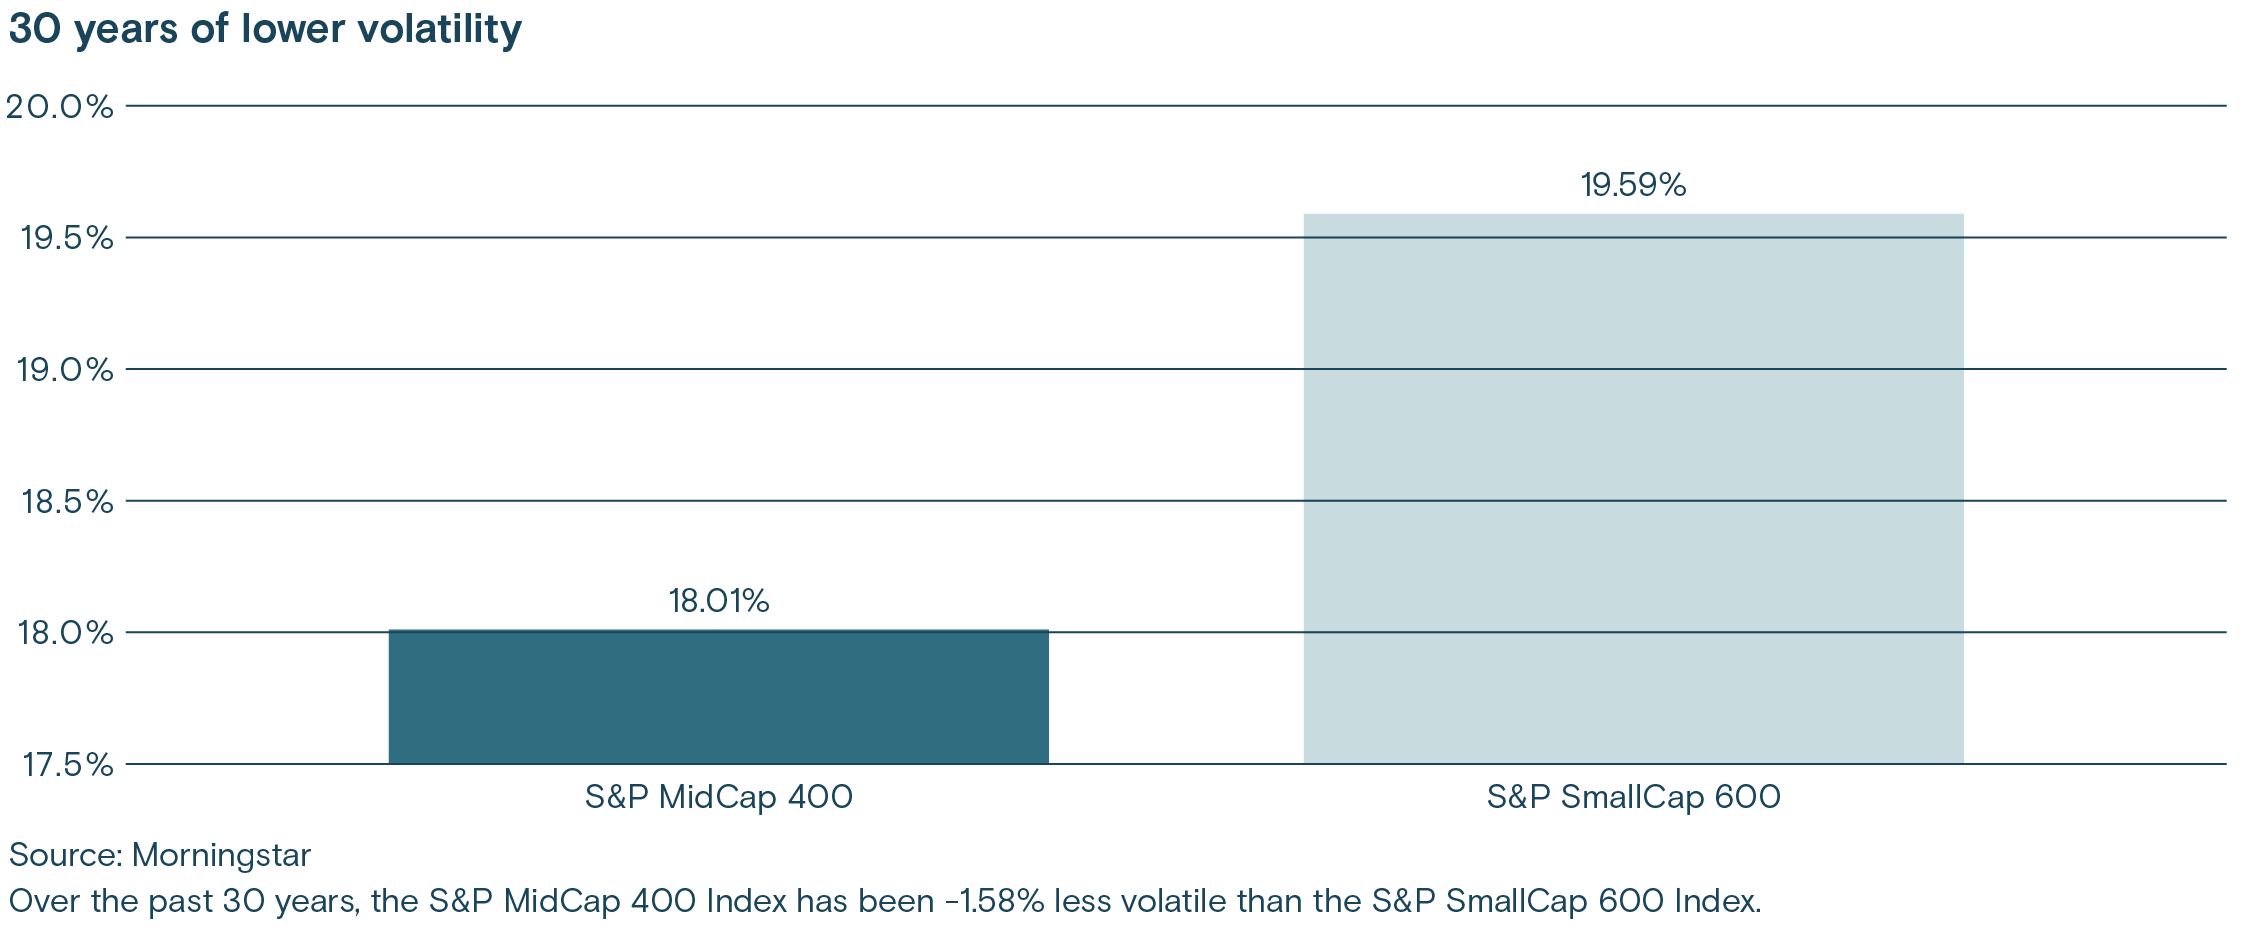
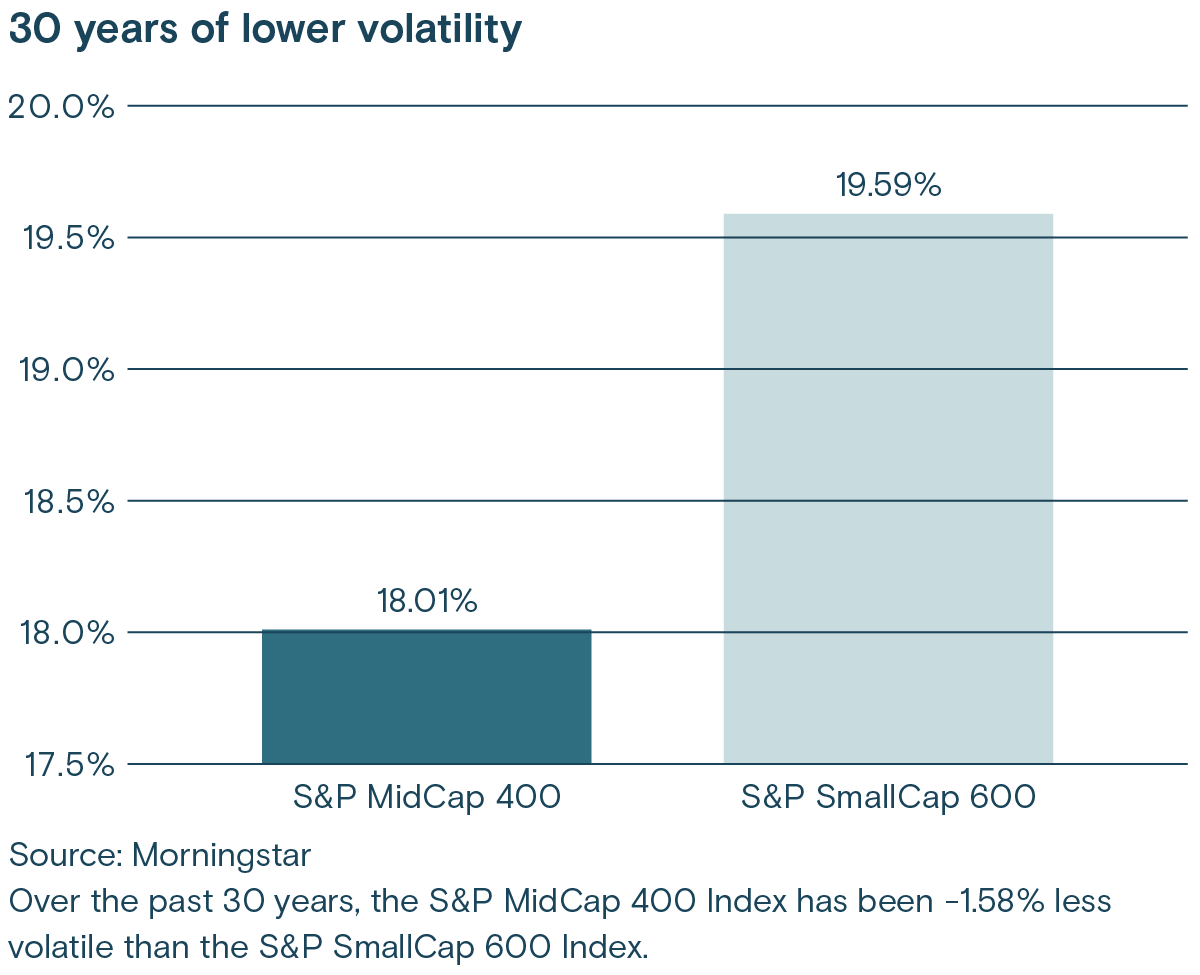
But even with this growth, mid-cap companies don’t exhibit the risk of volatility typically found in small-caps as measured by the standard deviation of returns.
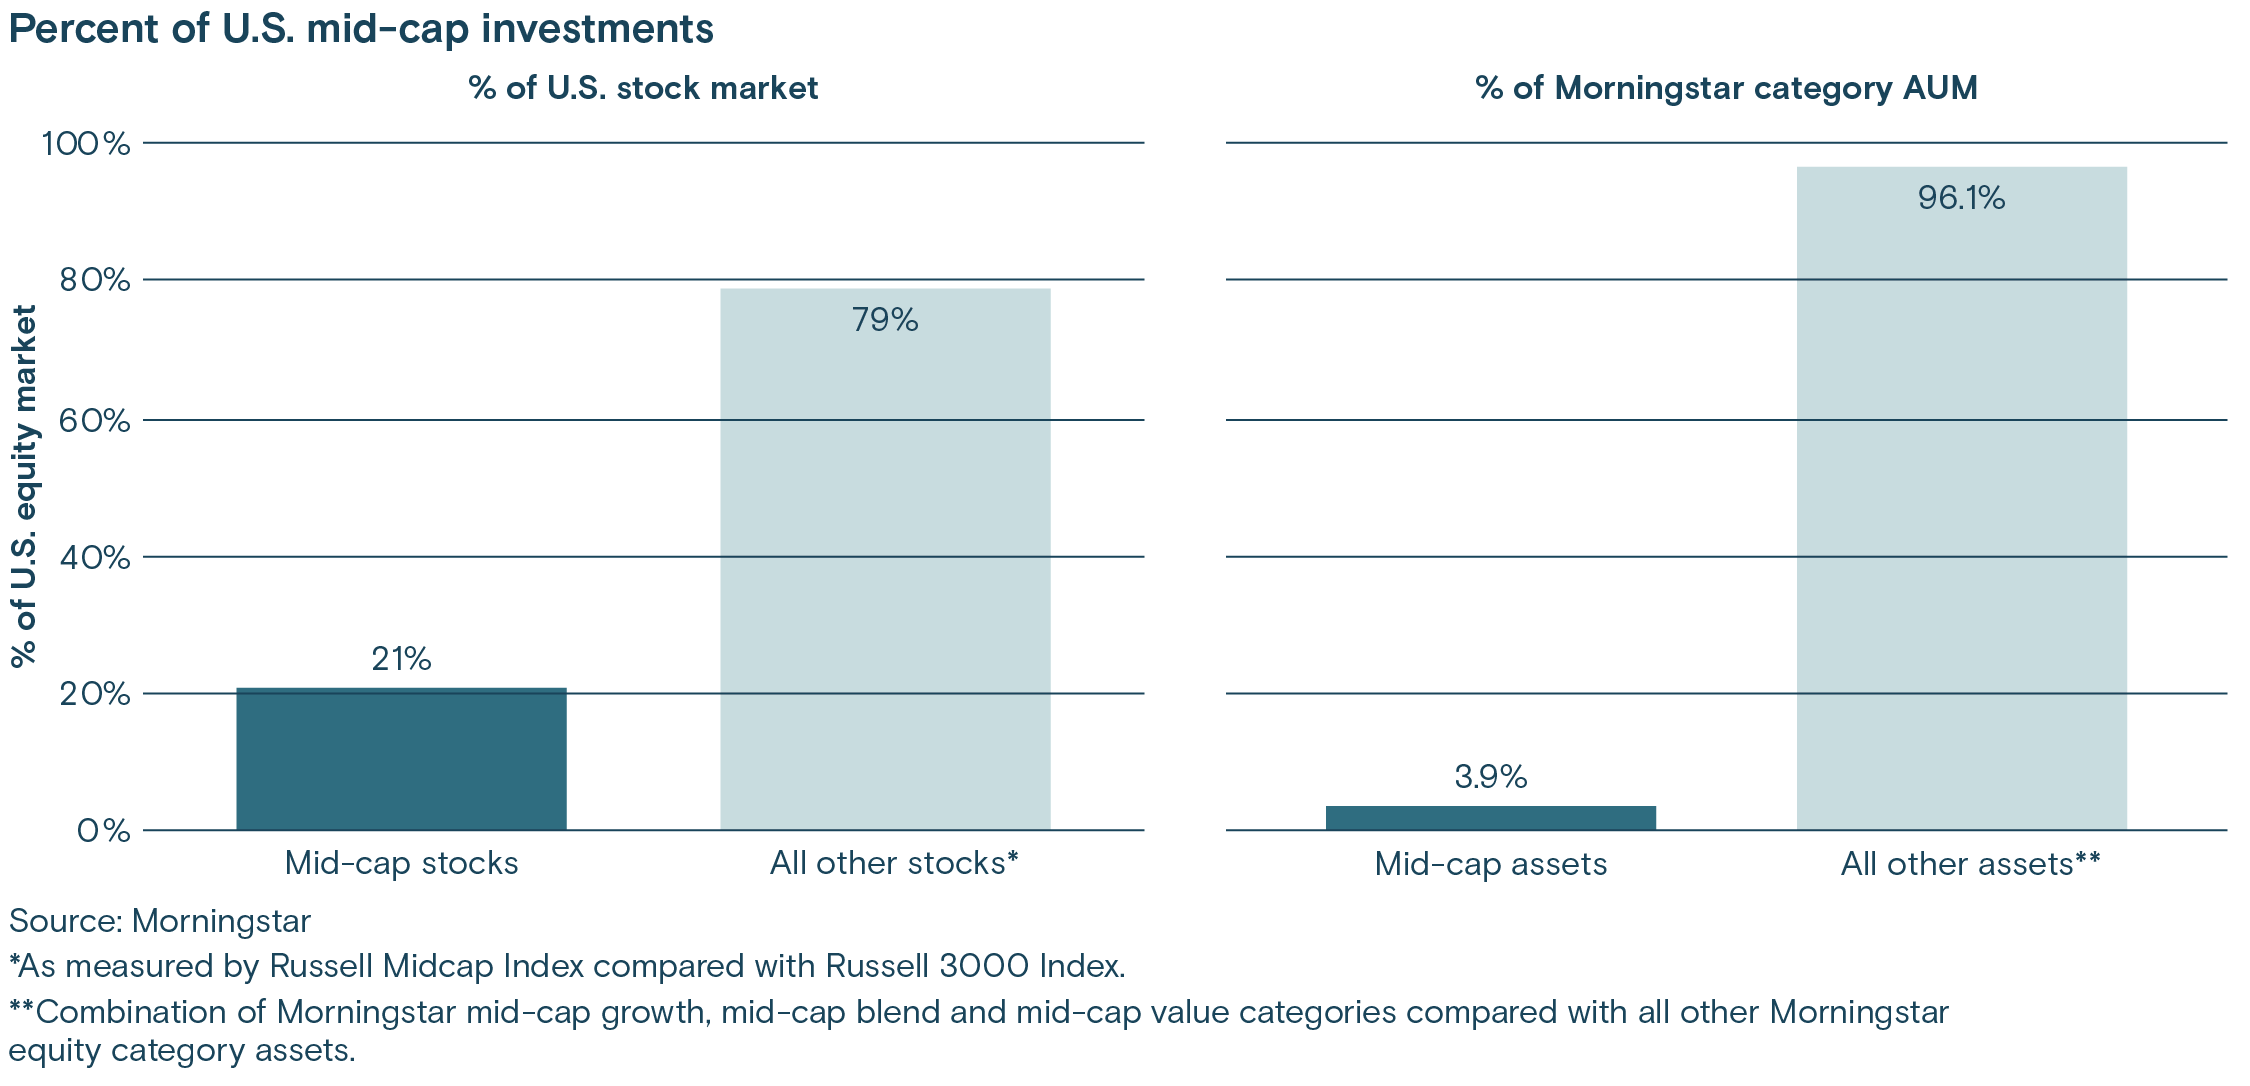
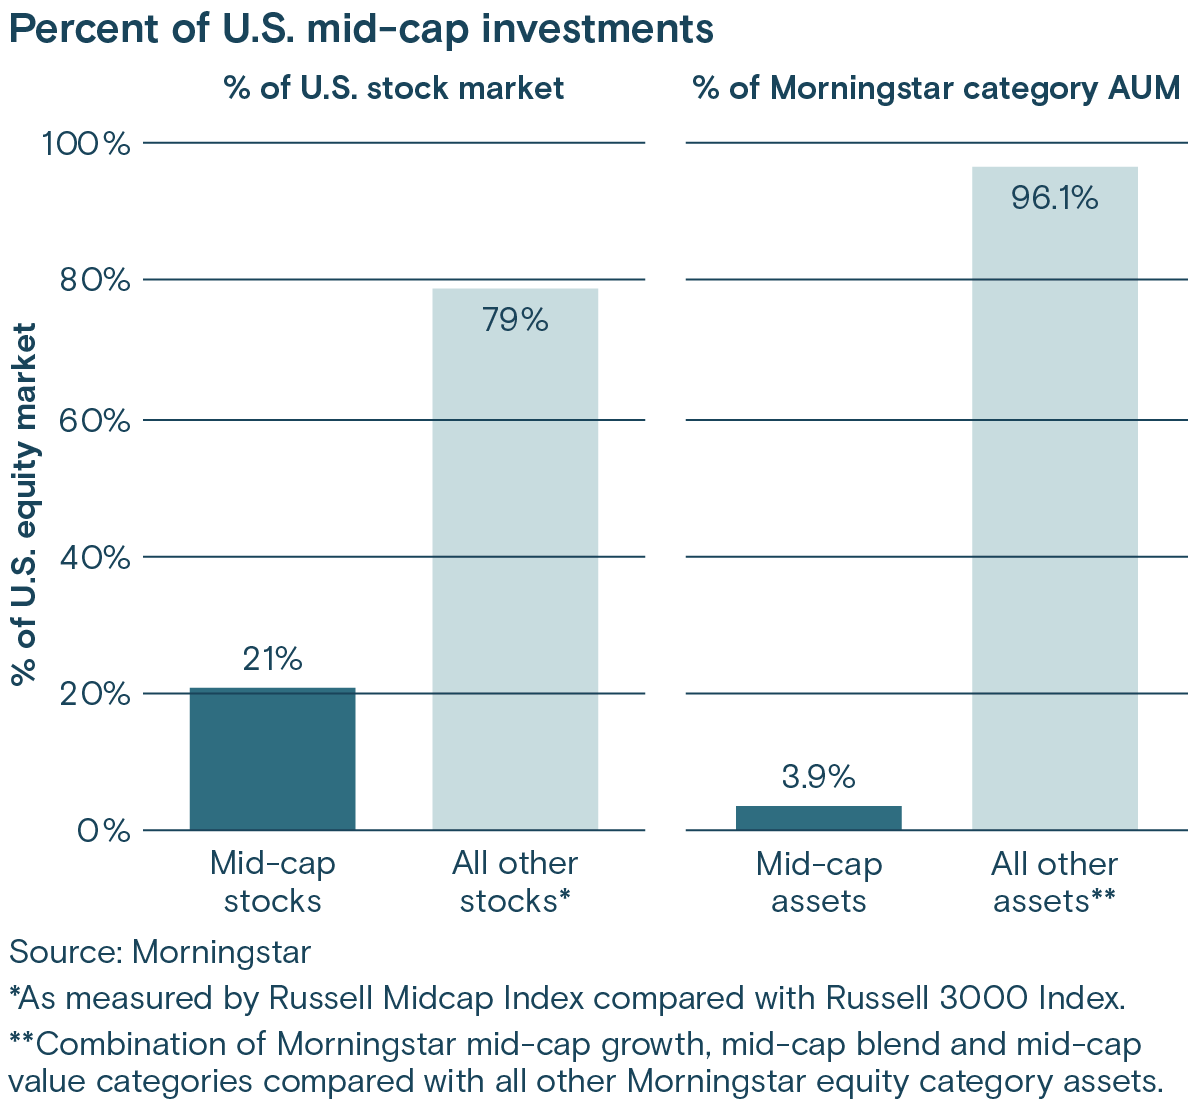
Despite these qualities, mid-caps are often underrepresented in portfolios and may receive less investor attention than larger companies. As a result, investors may overlook a segment of the market that combines many of the characteristics they seek: quality, growth potential and attractive valuations. Mid-cap stocks make up about 21% of the entire U.S. stock market but only account for about 4% of assets invested in U.S. equity categories.
Mid-cap equities offer a distinctive investment opportunity that extends beyond simple market-cap classification. Their combination of growth potential, operational maturity, domestic market exposure and historically attractive valuations makes them a valuable segment for financial professionals to consider when constructing diversified portfolios.
While large-cap stocks may dominate headlines, mid-cap companies have demonstrated characteristics that can support long-term investment objectives and may represent an overlooked source of opportunity for investors seeking a balance between growth and quality.
Thrivent Asset Management offers four mid-cap actively managed mutual funds and ETFs:
Thrivent Mid Cap Value ETF – TMVE
Thrivent Mid Cap Growth Fund – TMCGX
Thrivent Mid Cap Stock Fund – TMSIX
Thrivent Small-Mid Cap Equity ETF – TSME
Behind TMVE, TMCGX, TMSIX and TSME is a team of more than 30 dedicated analysts and portfolio managers who combine deep fundamental research with active portfolio management. Their disciplined process focuses on:
By conducting extensive company research and applying experienced investment judgment, the team seeks to uncover opportunities that may be overlooked by passive strategies and position portfolios for long-term success.
All information and representations herein are as of 06/30/2026, unless otherwise noted.
The views expressed are as of the date given, may change as market or other conditions change, and may differ from views expressed by other Thrivent Asset Management, LLC associates. Actual investment decisions made by Thrivent Asset Management, LLC will not necessarily reflect the views expressed. This information should not be considered investment advice or a recommendation of any particular security, strategy or product. Investment decisions should always be made based on an investor's specific financial needs, objectives, goals, time horizon, and risk tolerance.
Risks: Medium-sized companies often have greater price volatility, lower trading volume, and less liquidity than larger, more established companies. Common stocks of companies that rely extensively on technology, science or communications in their product development or operations may be more volatile than the overall stock market and may or may not move in tandem with the overall stock market. Value investing includes undervalued securities whose value may not rise as quickly as anticipated if the market doesn’t recognize their intrinsic value. Securities may be affected by company performance and market conditions. The Adviser’s assessment of investments may prove incorrect, resulting in losses or poor performance. These and other risks are described in the Funds’ prospectus.
Any indexes mentioned are unmanaged and do not reflect the typical costs of investing. Investors cannot invest directly in an index.
S&P 500® Index is a market-cap weighted index that represents the average performance of a group of 500 large-capitalization stocks.
S&P MidCap 400® Index is a market-cap weighted index that represents the average performance of a group of 400 mid-capitalization stocks.
Russell Top 200® Index tracks the performance of the 200 largest companies in the Russell 3000, serving as a benchmark for ultra-large-cap U.S. stocks.
Russell 2000® Index measures the performance of U.S. small capitalization equities.
Russell 2500® Index is a U.S.-based, market-cap-weighted equity index that tracks the performance of the smallest 2,500 companies in the Russell 3000, all with market capitalizations under $10 billion.
MSCI All Country World Index ex-USA - USD Net Returns is a float-adjusted market capitalization index designed to measure the combined equity market performance of large- and mid-cap securities in developed and emerging markets outside of the US.
The MSCI World ex USA Mid Cap Index is a market-cap-weighted index that tracks mid-cap stocks across 22 of 23 Developed Markets (DM) countries excluding the United States.
S&P SmallCap 600® Index represents the average performance of a group of 600 small capitalization stocks.
Russell Midcap® Index measures the performance of U.S. medium-capitalization equities.
Russell 3000® Index measures the 3,000 largest U.S.-traded equities, which represent roughly 98% of all U.S incorporated equities.
Past performance is not necessarily indicative of future results.
![Q4 2026 Market Outlook [VIDEO]](/content/dam/thrivent/fp/fp-insights/market-updates/q4-2026-market-outlook/q4-2026-market-outlook-1920x1080.png/_jcr_content/renditions/cq5dam.web.1280.1280.jpeg)