Now leaving ThriventFunds.com


You're about to visit a site that is neither owned nor operated by Thrivent Asset Management.

In the interest of protecting your information, we recommend you review the privacy policies at your destination site.

Financial Professional Site Registration

Complete this form to get full access to the entire financial professional site.

By clicking “Register”, you agree to our privacy and security policies and that you are a financial professional.

Access will be granted immediately, but the registration process may take up to 5 business days to complete.

Thank you for registering

You can now enjoy all financial professional content.

If your download does not start automatically, click here.

An error occurred

Please check back later.

SEPTEMBER 2025 MARKET UPDATE

Expectations for lower rates return

09/08/2025


Key points

Economic impact

Interest rates are unlikely to rise much further or fall quickly.

Market

Investors may want to consider rotating from cash to Treasuries and/or corporate bonds.


WRITTEN BY:
Chief Investment Strategist
WRITTEN BY:
Steve Lowe, CFA,Chief Investment Strategist

Thrivent Asset Management contributors to this report: John Groton, Jr., CFA, director of administration and materials & energy research; Matthew Finn, CFA, head of equity mutual funds; and Charles Hofstrom, CFA, investment product manager


Key points

Steepening curve

Higher inflation concerns and anticipated Fed fund rate cuts influenced Treasury yields.

Continued highs

Stocks set more records across several indices thanks to solid earnings reports and anticipated rate cuts.


August’s benchmark returns

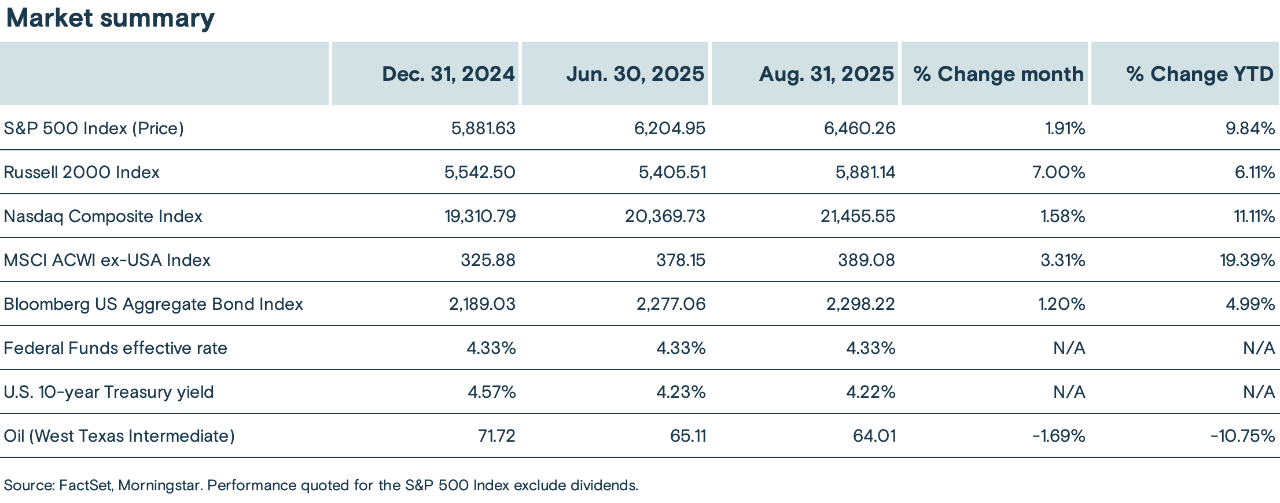
A chart summarizing the performance of select market indexes, the Federal Funds effective rate, 10-year T bonds, and oil.

What mattered in August

The economy: Economic data released over the month was generally constructive, with consumption (a large portion of the economy) remaining robust and second-quarter earnings prompting the largest increase in future earnings estimates in almost four years. Inflation rose but was largely in line with expectations for higher prices as higher tariffs were implemented. However, employment data in July and August was weak, increasing the chances of lower interest rates from the U.S. Federal Reserve (Fed).

Stocks: August was generally a strong month for stocks (despite some significant early volatility) and was the fourth consecutive month that major indices posted gains. The S&P 500® Index rose 1.91%, setting new highs as the month came to a close. The Russell 2000® Index, which measures the performance of small cap stocks, surged 7.00%, largely on expectations for lower interest rates, while the S&P MidCap 400® Index rose 3.00% and the Dow Jones Industrial Average reached a new record high. Uncertainty about the amount and impact of tariffs remained over the period but was overshadowed by increased optimism about the economic benefits of lower interest rates.

Bonds: The Treasury yield curve steepened in August as shorter-dated bonds rallied on increased expectations for a resumption in interest rate cuts. At month end, bond markets were pricing a high probability of a 0.25% rate cut at the Fed’s September meeting. Benchmark 10-year Treasury yields ended the month modestly lower (at 4.22%), while 30-year bond yields rose—mainly due to lingering concerns about inflation and the sustainability of high U.S. government debt levels. Investment-grade corporate bond yield spreads (the yield paid over comparable Treasuries) continued to tighten. The Bloomberg U.S. Aggregate Bond Index rose 1.20% in August, bringing its year-to-date gain to 4.99%.

How it changes our outlook:

The economy: While we are watching each data release closely, we remain cautious about forecasting major changes in long-term trends based on relatively short-term data, particularly given the distortions recent policy uncertainty may be having on recent data releases. Employment data has been a cause for concern, but we continue to expect the economy will find support in strong corporate earnings, a low unemployment rate, tax cuts, deregulation and an expansionary fiscal policy.

The odds of a recession have risen; however our base case remains that growth will slow but the economy will avoid a recession

Stocks: We maintain a modest overweight to equities over fixed income given our structurally positive long-term outlook for the economy and our bias toward prioritizing economic fundamentals and corporate earnings as the primary determinant of investment returns over the long term. But we caution that shorter-term volatility is likely to persist and could provide attractive opportunities to adjust asset class exposures. 

Maintain exposure, favoring higher-quality and large-cap stocks

Bonds: The long-term outlook for Treasury yields is complicated by the high levels of uncertainty around expected economic growth, the path of inflation, the strength of the U.S. dollar and the U.S. fiscal deficit’s impact on both the supply of and demand for Treasuries. But it is increasingly likely the Fed will lower interest rates, benefiting the short end of the yield curve, but at the same time send longer-term rates higher on expectations of stronger growth and inflation.

Stay at the short end of the Treasury curve and favor higher-quality corporate bonds with less exposure to tariff uncertainty and macroeconomic weakness

August’s key economic data

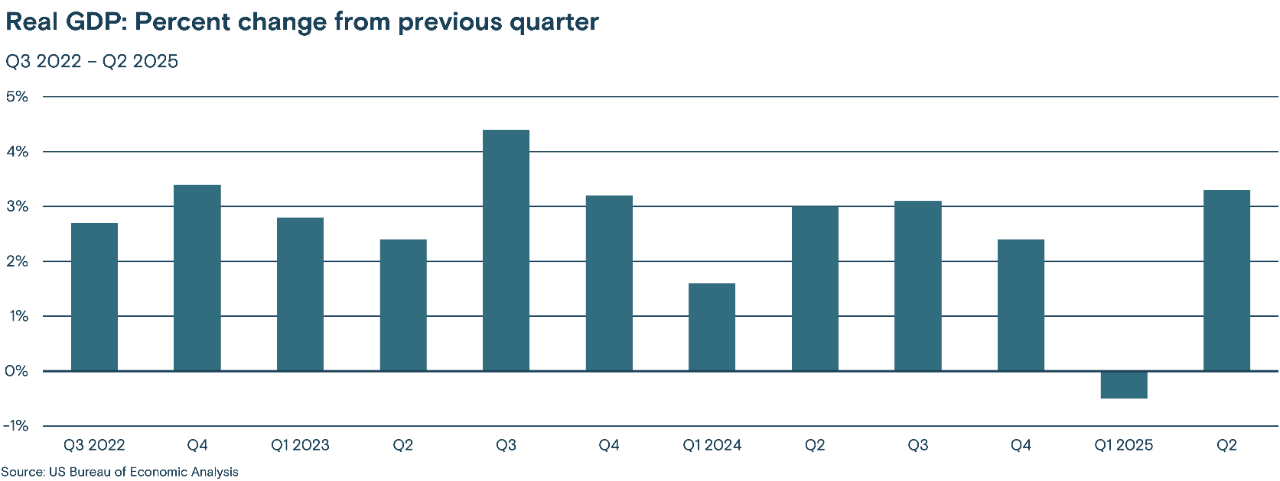
Second-quarter gross domestic product (GDP) was revised higher to 3.3% from the 3.0% estimate reported in July, and the August Purchasing Managers’ Index (PMI) survey was encouraging, particularly in the manufacturing sector. U.S. factory activity declined in August for the sixth month in a row, but the Institute for Supply Management’s new-bookings measure increased 4.3 points, the largest rise since early last year. 

  This bar chart shows the real GDP percent change from the previous quarter, Q3 2022 to Q2 2025.


The consumer: Still spending despite increasing concerns

U.S. retail sales rose 0.5% in July, in line with expectations, and June’s 0.6% rise was revised higher to 0.9%. However, consumer sentiment, as measured by the University of Michigan, fell 5.0% in July as concerns about future inflation and employment grew. The New York Fed’s monthly survey of inflation for the coming year ticked higher to 3.1% from 3.0% in June, while reoccurring applications for unemployment benefits rose to their highest levels since November of 2021. Home sales were also notably slow, with contracts for buying a home being canceled at a record rate while sales to non-U.S. citizens surged 33% from last year.

Employment: Jobs data disappointed again

August’s employment report showed 22,000 new jobs were created during the month, below expectations closer to 75,000. The unemployment rate rose to 4.3% from 4.2% in July (which was up from 4.1% in June). New job creation in June was revised lower, while July’s figure was revised higher, resulting in a net 21,000 fewer jobs added in those months. Despite fewer new jobs being created, average hourly earnings in August rose 0.3%, in line with expectations.

Inflation rises, in line with expectations

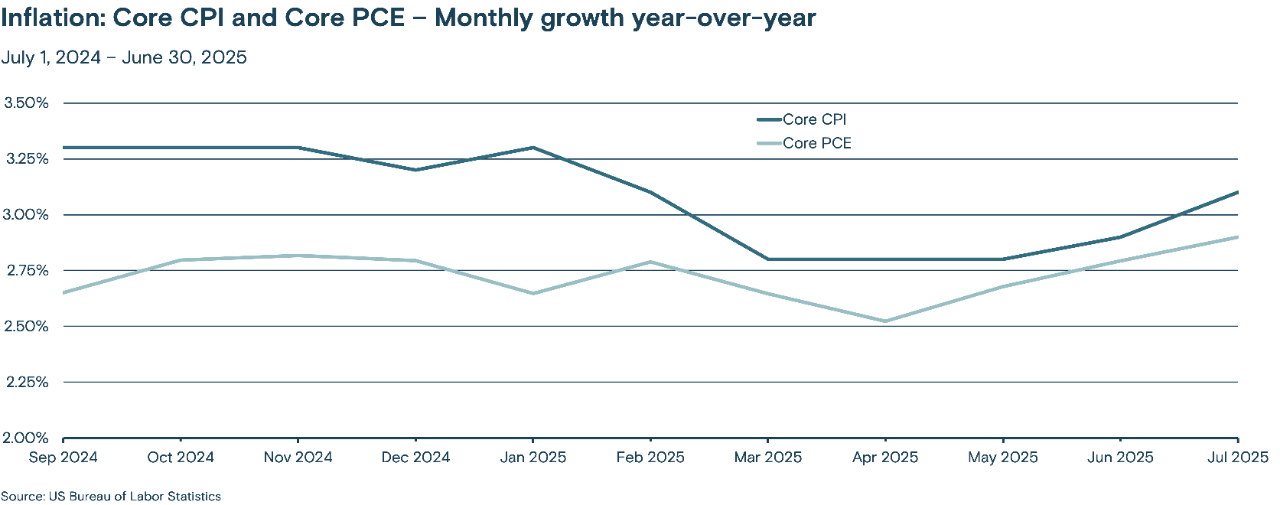
July’s Consumer Price Index (CPI) rose 2.7% relative to July 2024—slightly less than expected. Core CPI (which excludes the more volatile food and energy sectors) rose 0.3% from June—its fastest pace since the start of the year—and 3.1% relative to July of last year, an increase from last month’s 2.9% rise and above consensus expectations.

July’s Personal Consumption Expenditures (PCE) Price Index rose 2.6% from last July, the same rate as in June and near consensus expectations. Core PCE, which is the Fed’s preferred inflation measure, rose 2.9% relative to last year. This was in line with expectations but its highest rate since February.

This line graph tracks the monthly year-over-year growth of the Core CPI (Consumer Price Index) and Core PCE (Personal Consumption Expenditures) from September 2024 through June 2025.

RELATED CONTENT

RELATED ARTICLE

2025 midyear outlook: Living with volatility

We don’t anticipate the market roller coaster will get less bumpy in the second half of 2025.

RELATED PODCAST

2025 Midyear Market Outlook

Will market volatility persist through the rest of 2025?

How key markets responded

U.S. stocks set more new highs

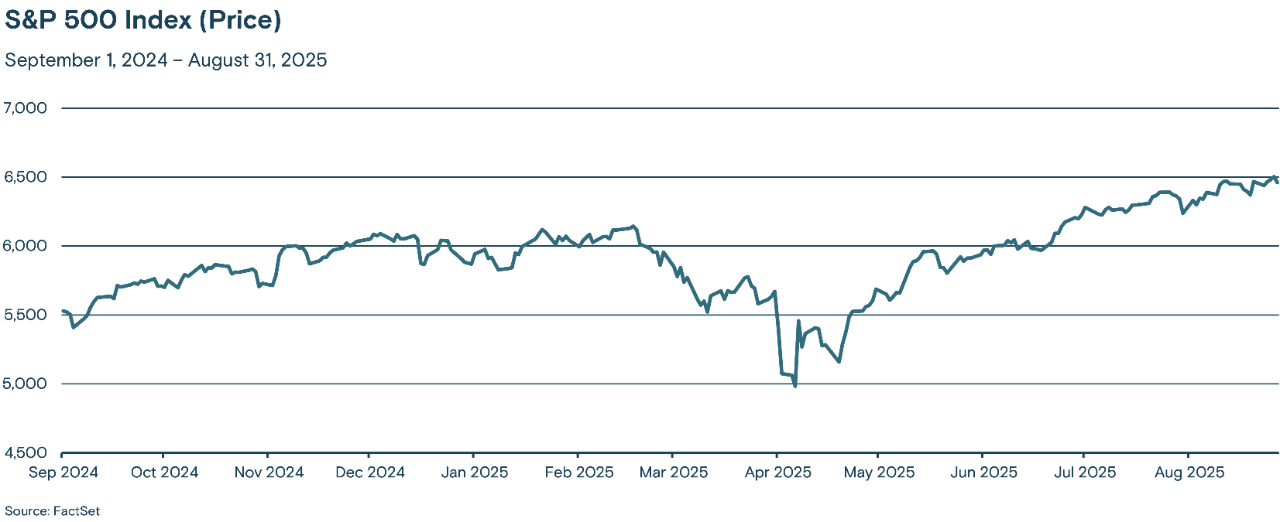
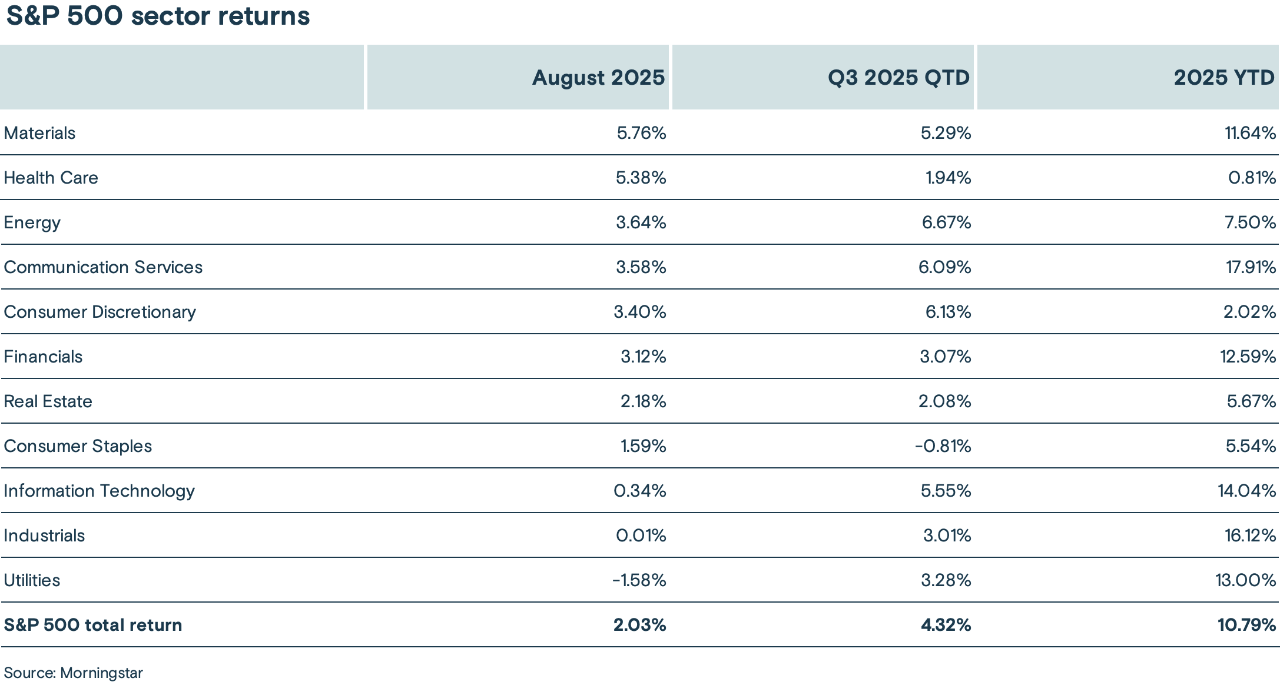
U.S. stocks rose again in August, with the benchmark S&P 500 Index of large-cap stocks increasing 1.91%, the benchmark Russell 2000 Index of small-cap stocks surging 7.00% and the technology-heavy NASDAQ Composite Index® rising 1.58%. The S&P 500 Index was supported by rising earnings estimates, which rose at the highest pace in almost four years, while the Russell 2000 Index benefited from growing expectations that the Fed will be lowering interest rates. This particularly benefits smaller companies that are typically more sensitive to borrowing costs. Performance in the S&P 500 Index was broad based, with 10 of the 11 sectors generating a positive return. Materials (up 5.76%) and health care (up 5.38%) led the way, while utilities was the lone detractor (down 1.58%).

Chart depicting the value of the S&P 500 Index from September 2024 through August 2025


The table below shows the past month, quarter-to-date and year-to-date performance results of the 11 sectors:

Chart depicting the August 2025, Q3 2025 quarter-to-date and year-to-date returns of 11 S&P 500 sectors.


International equities outperformed

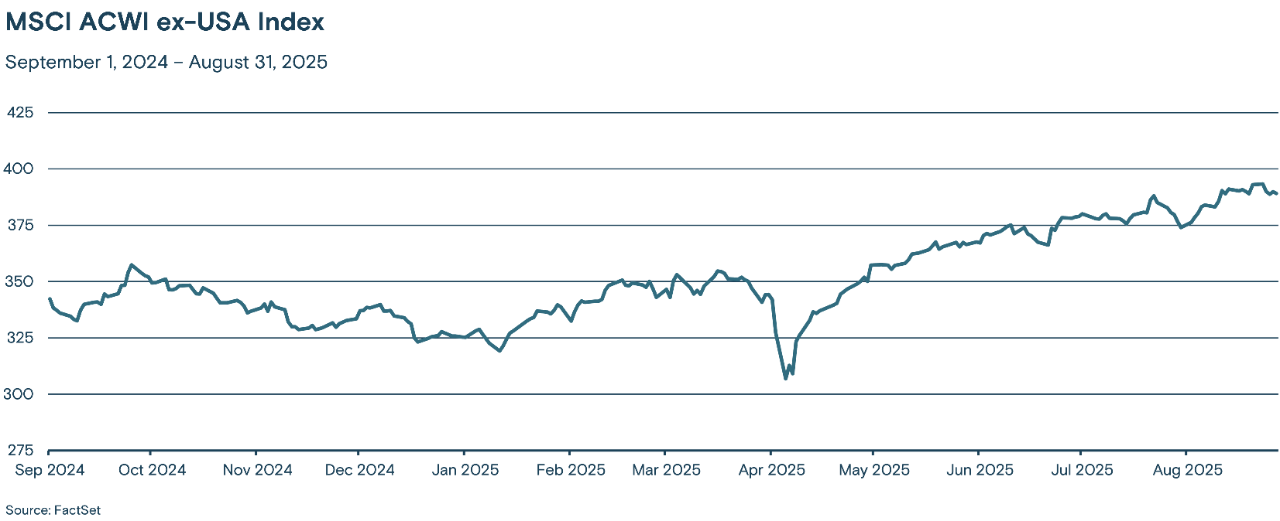
The MSCI ACWI ex-USA Index, which tracks stocks across developed and emerging-market economies across the world (excluding the U.S.), rose 3.31% in August, outperforming the S&P 500 Index. Japanese equities were particularly strong, supported by the U.S. and Japan reaching agreement on trade tariffs and better-than-expected domestic growth. Stocks were generally positive in Europe, though French stocks were relatively weak on renewed political concerns. Strong performance in China supported emerging-market equities, which rose 1.5% during the period. Year to date through the end of August, the MSCI ACWI ex-USA Index is up 19.39%, well above the S&P 500 Index at 9.84% and the Russell 2000 Index at 6.11%.

This line graph tracks the MSCI ACWI ex-USA Index from September 2024 through August 2025.

Benchmark Treasury yields fell as the curve steepened

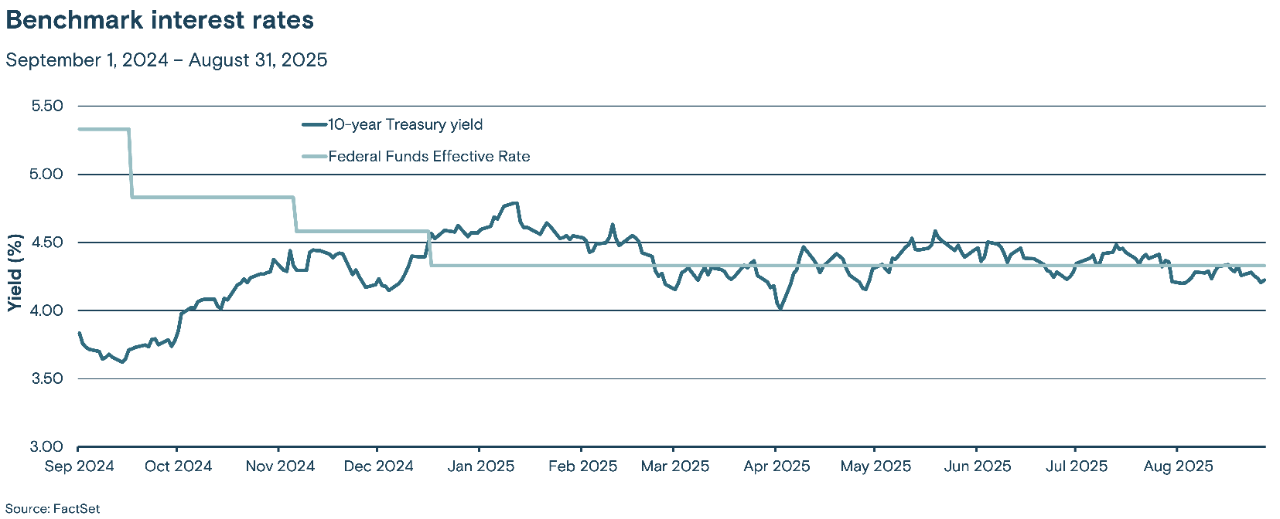
Benchmark 10-year Treasury yields ended the month at 4.22%, 0.15% below their yield at the end of July, while shorter-dated 2-year Treasury yields pushed through their year-to-date lows in early September. Longer-dated 30-year Treasury bond yields rose over the period, largely due to concerns about higher inflation. Finally, Fed Chairman Jerome Powell’s remarks August 22 in Jackson Hole signaled rate cuts were warranted given recent economic data.

This line graph tracks two benchmark interest rates, the Federal Funds effective rate and the 10-year Treasury yield, from September 2024 through August 2025.

Credit spreads continued to tighten

Investment-grade corporate bonds again saw credit spreads tighten over the month, supported by second-quarter earnings reports and growing expectations for interest-rate cuts and continued demand for yield with interest rates still high versus recent history. The Bloomberg U.S. Aggregate Bond Index, which has a large allocation to investment-grade corporate bonds, rose 1.20% in August, boosting its year-to-date gain to 4.99%.

The U.S. dollar weakened again

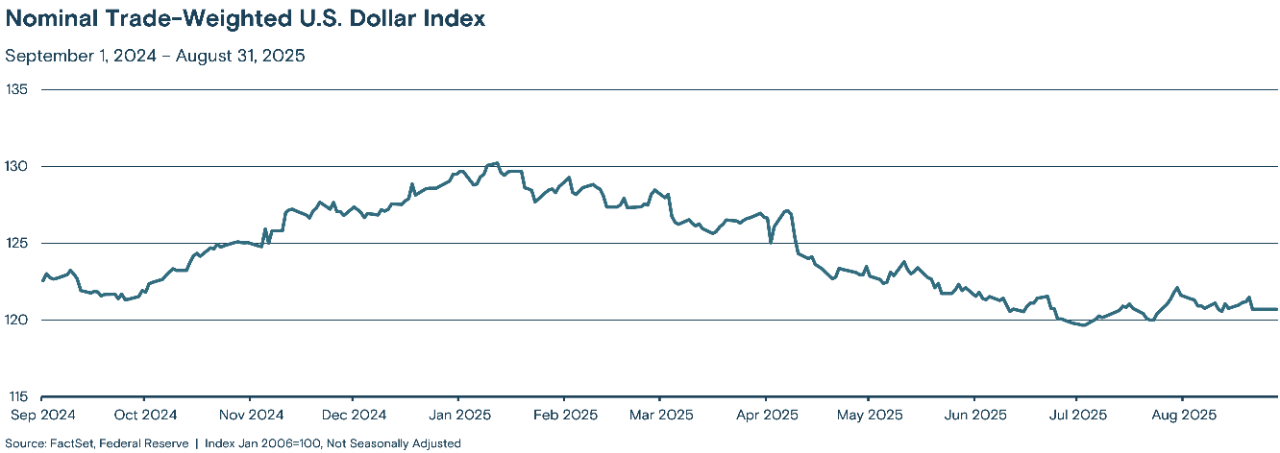
The Nominal Trade-Weighted U.S. Dollar Index fell 1.16% in August, though remained within the range established during the summer. Relative to the steady downtrend between January and June, the U.S. dollar has stabilized near current levels as uncertainty over U.S. economic policy has diminished. 

This line graph titled "Nominal Trade-Weighted U.S. Dollar Index" tracks the index value from September 2024 through August 2025.

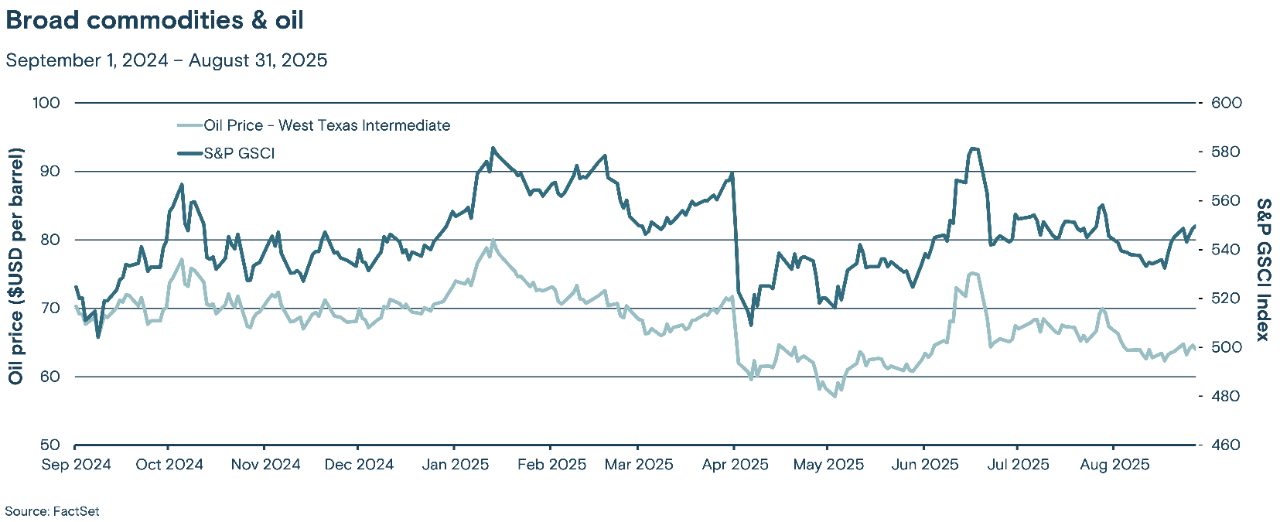
Commodity prices declined

The S&P GSCI Index (a broad-based and production-weighted index representing the global commodity market) fell 0.77% in August, though saw a mid-month rebound from significantly lower levels. Early in September, gold set a record high on a combination of expectations for lower interest rates (which lowers the opportunity cost of owning non yield-paying investments) and rising uncertainty about the management of interest rates at the Fed. Oil prices dropped significantly, with a barrel of West Texas Intermediate (a grade of crude oil used as a benchmark in oil pricing) falling 7.58% over the month. 

This line graph tracks the price of West Texas Intermediate crude oil and the S&P GSCI commodity index from September 2024 through August 2025.

Media contact: Callie Briese, 612-844-7340; callie.briese@thrivent.com

All information and representations herein are as of 09/08/2025, unless otherwise noted.

The views expressed are as of the date given, may change as market or other conditions change, and may differ from views expressed by other Thrivent Asset Management, LLC associates. Actual investment decisions made by Thrivent Asset Management, LLC will not necessarily reflect the views expressed. This information should not be considered investment advice or a recommendation of any particular security, strategy or product. Investment decisions should always be made based on an investor's specific financial needs, objectives, goals, time horizon, and risk tolerance.

This article refers to specific securities which Thrivent Mutual Funds may own. A complete listing of the holdings for each of the Thrivent Mutual Funds is available on thriventfunds.com.

The S&P 500® Index is a market-cap weighted index that represents the average performance of a group of 500 large-capitalization stocks.

The Russell 2000® Index is an unmanaged index considered representative of small-cap stocks.

The Nasdaq Composite Index is a stock market index that includes almost all stocks listed on the Nasdaq stock exchange. The Nasdaq – National Association of Securities Dealers Automated Quotations – is an electronic stock exchange with more than 3,300 company listings.

The MSCI ACWI ex-USA Index is an unmanaged index considered representative of large- and mid-cap stocks across developed and emerging markets, excluding the U.S.

The Bloomberg U.S. Aggregate Bond Index is an unmanaged index considered representative of the U.S. investment-grade, fixed-rate bond market.

The Federal Funds effective rate is the interest rate at which depository institutions (mainly banks) lend reserve balances to other depository institutions overnight on an uncollateralized basis. In simpler terms, it's the rate banks charge each other for short-term loans to meet their reserve requirements.

The Consumer Confidence Index (CCI) is a survey administered by the Conference Board. The CCI measures what consumers are feeling about their expected financial situation, whether that's optimistic or pessimistic.

The University of Michigan Consumer Sentiment Index is a consumer confidence index published monthly by the University of Michigan.

The Consumer Price Index measures the monthly change in prices paid by U.S. consumers for a basket of goods and services.

The Core Consumer Price Index (CPI) measures changes in the prices of goods and services, with the exclusion of food and energy.

The Personal Consumption Expenditures (PCE) Price Index, also known as consumer spending, is a measure of the spending on goods and services by people of the U.S.

The Core Personal Consumption Expenditures (PCE) Price Index, also known as consumer spending, is a measure of the spending on goods and services, excluding food and energy prices, by people of the U.S.

The Nominal Trade-weighted U.S. Dollar Index measures the value of the U.S. dollar based on its competitiveness versus trading partners.

The Institute for Supply Management Purchasing Managers Index (PMI) measures the month-over-month change in economic activity within the manufacturing sector.

Any indexes shown are unmanaged and do not reflect the typical costs of investing. Investors cannot invest directly in an index.

Past performance is not necessarily indicative of future results.

Related Insights