![ROI on AI? [PODCAST]](/content/dam/thrivent/fp/fp-insights/advisors-market360-podcast/advisors-market360-podcast-16x9-branding-insights-card.jpg/_jcr_content/renditions/cq5dam.web.1280.1280.jpeg)
ROI on AI? [PODCAST]
Spending on AI infrastructure continues at a breakneck pace. Will this growth continue?
10/28/2025
NOVEMBER 2025 MARKET UPDATE
11/07/2025
Investors may want to consider rotating from cash to Treasuries and/or corporate bonds.
Thrivent Asset Management contributors to this report: John Groton, Jr., CFA, director of administration and materials & energy research; Matthew Finn, CFA, head of equity mutual funds; and Charles Hofstrom, CFA, investment product manager
Weak manufacturing and low consumer confidence were offset by strong corporate earnings and positive private payrolls.
Employment reports and the Consumer Price Index highlight cautious investor sentiment.
Inflation remained high, and the Fed cut interest rates a second time for this year.
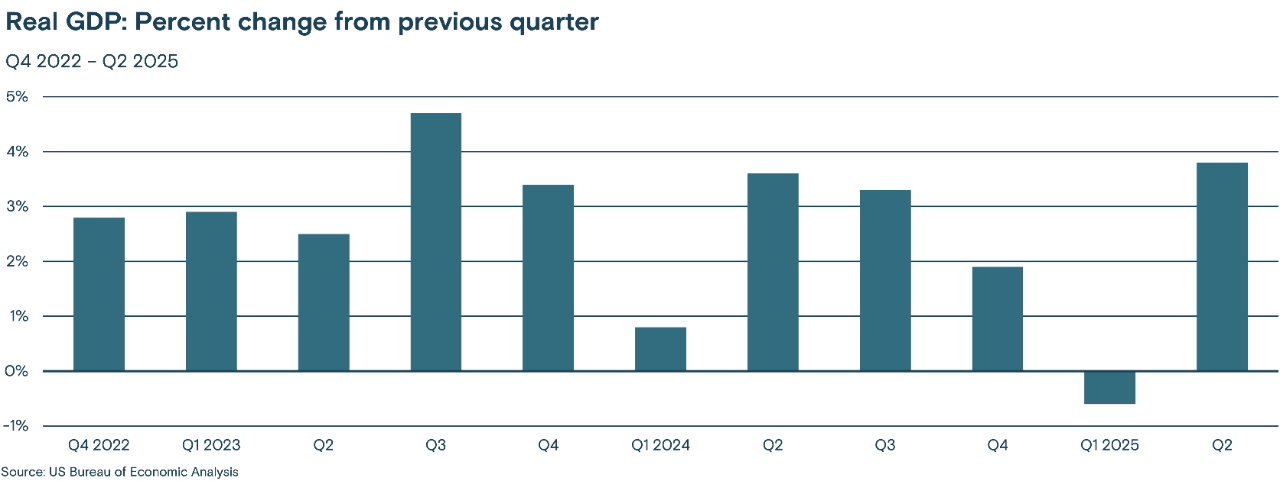
The economy: Economic data was limited over the month as a result of the U.S. government shutdown, but the data released was mixed. Manufacturing data remains weak, consumer confidence remains low, inflation remains relatively high but stable (despite tariffs), while reported corporate earnings were strong and private payroll data suggested a slight rebound in employment. The U.S. Federal Reserve (Fed) cut interest rates by 0.25% for the second consecutive month, though it also signaled that the pace of future cuts could be slower than the market had expected.
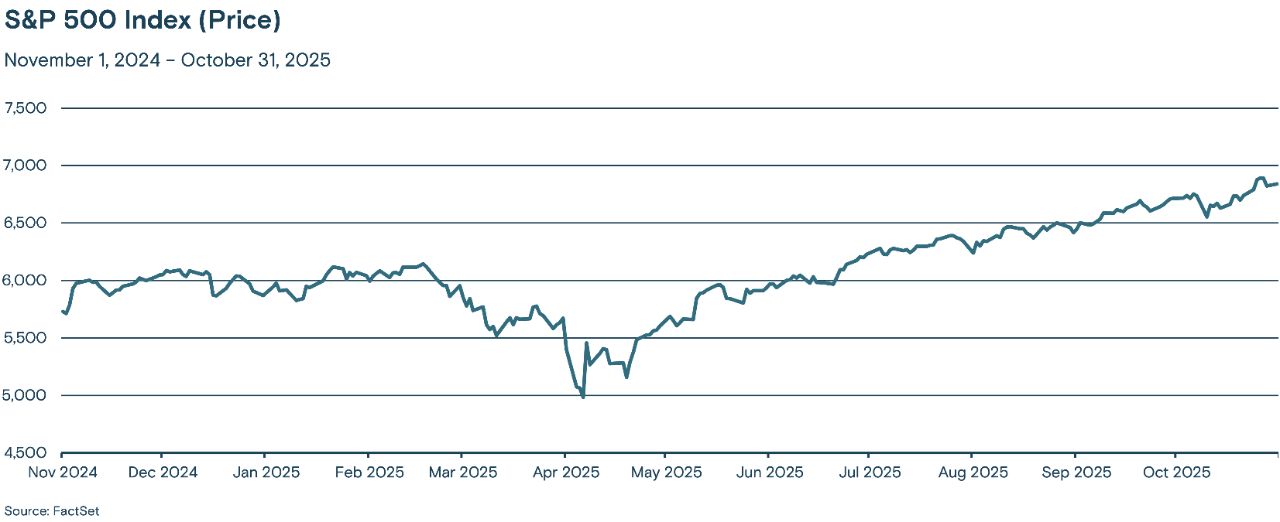
Stocks: Despite mid-month corrections — primarily due to trade tensions — October was generally a strong month for stocks, marking the sixth consecutive month that the S&P 500® Index posted a gain. However, sentiment late in the month turned more cautious amid growing concern about the market’s narrow breadth with returns driven by a few technology and technology-related companies that are richly valued.
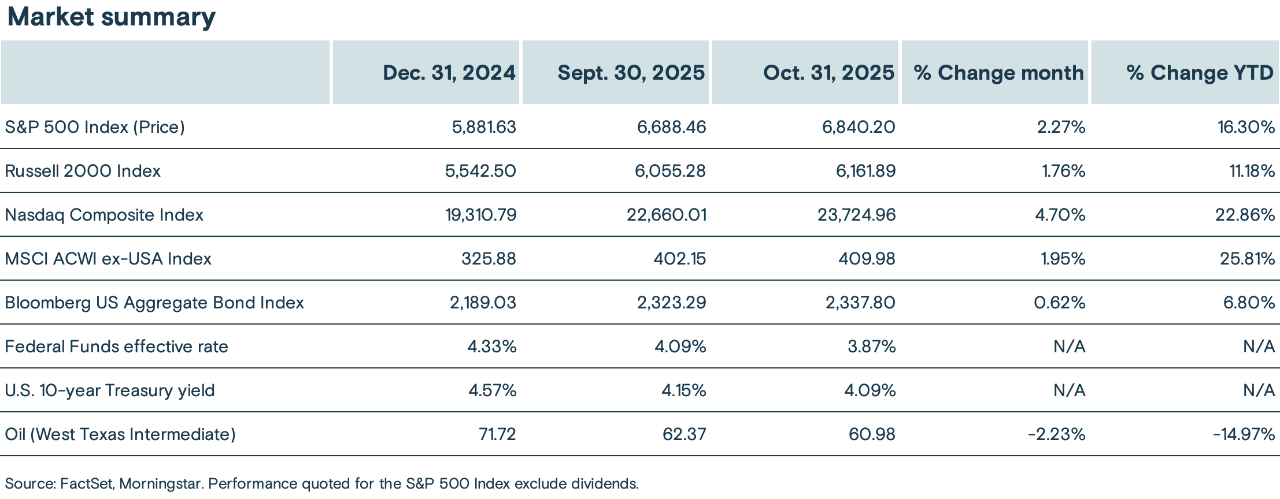
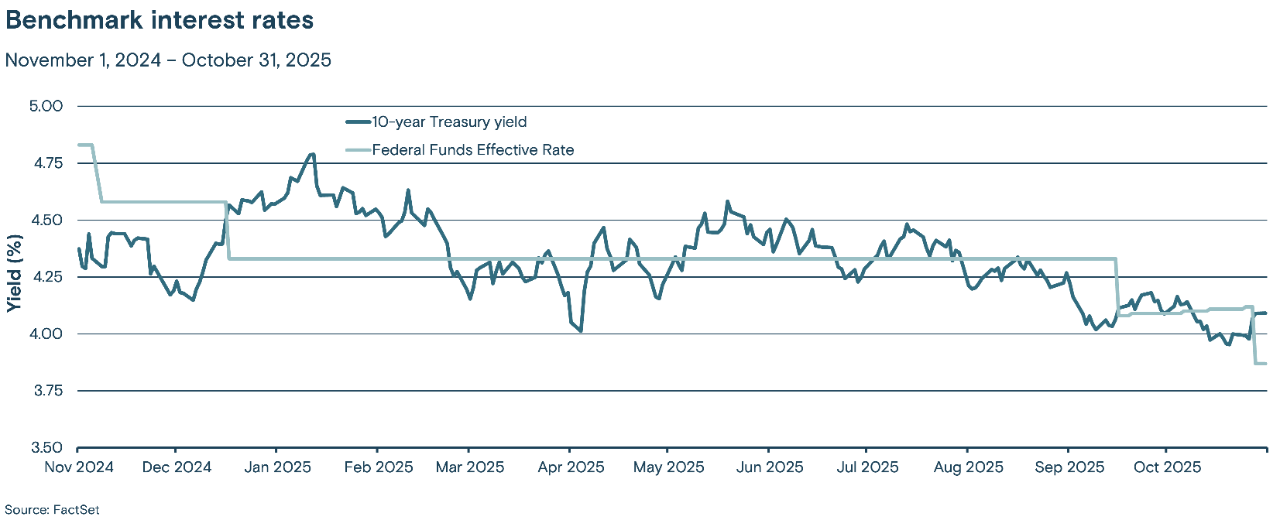
Bonds: Benchmark 10-year Treasury yields remained relatively stable in October, dipping below 4.0% mid-month and ending the month at 4.09%. Meanwhile, shorter-dated Treasury yields rose on expectations that the pace of rate cuts could be slower than anticipated. Investment-grade and high-yield corporate bond yield spreads (the yield paid over comparable Treasuries) widened during the period. The Bloomberg U.S. Aggregate Bond Index rose 0.62% in October, bringing its year-to-date gain to 6.80%.
The economy: We remain cautious about forecasting significant changes in long-term economic trends based on relatively short-term data, particularly given the suspension of key economic data releases and the distortions policy uncertainty may have had on recent data announcements. The employment market remains a weak point and a cause for concern. Still, we continue to expect the economy will find support in robust corporate earnings, a strong capital investment cycle, tax cuts, deregulation and an expansionary fiscal policy.
The odds of a recession have risen; however, our base case remains that growth will slow, but the economy will avoid a recession
Stocks: We maintain a modest overweight position in equities over fixed income given our structurally positive long-term outlook for the economy and our bias toward prioritizing economic fundamentals and corporate earnings as the primary determinants of investment returns over the long term. But valuations are high, and shorter-term volatility could provide attractive opportunities to adjust asset class exposures.
Maintain exposure, favoring higher-quality and large-cap stocks
Bonds: Interest-rate cuts are increasingly likely to occur incrementally over a longer period than the markets have anticipated. But, as the inflation rate seems increasingly likely to absorb higher tariffs without rising significantly, we expect lower interest rates in the months and quarters ahead. This suggests continuing to favor shorter-maturity Treasury securities. In the corporate credit market, recent credit spread widening supports our bias to favor higher-quality corporate bonds in the current environment with increasing signs of stress in highly leveraged companies.
Stay at the short end of the Treasury curve and favor higher-quality corporate bonds with less exposure to tariff uncertainty and macroeconomic weakness
Economic data was scarce in October as the Bureau of Labor Statistics, Bureau of Economic Analysis and the Census Bureau all ceased publishing and collecting data due to the government shutdown. Additionally, some private-sector sources of data rely on government data and were therefore unable to report.
However, the Chicago Purchasing Managers’ Index was reported at 43.8, above consensus expectations near 42.0, while the Institute for Supply Management (ISM) Manufacturing Purchasing Managers’ Index (PMI) fell to 48.7 from 49.1 in September. The ISM PMI is constructed to signal that any measure below 50 indicates contraction, and October’s figure marked the eighth consecutive month that the U.S. manufacturing sector has been contracting, according to the ISM measure.
The U.S. retail sales report was delayed due to the government shutdown. However, consumer sentiment, as measured by the University of Michigan, fell 1.5% in October (its third monthly decline in a row), as concerns about inflation and employment persisted. Consumer confidence, as measured by The Conference Board, was relatively stable, falling slightly from its upwardly revised September figure.
The September employment report has been delayed due to the U.S. government shutdown. While significant layoff announcements from some of the largest companies such as Amazon and Target dominated headlines during the month, the October report from Automatic Data Processing (ADP) showed a gain of 42,000 jobs. The data, which is based on private sector payroll data and released in early November, was both higher than consensus expectations and a reversal of ADP’s September data, which showed a decline of 29,000 jobs.
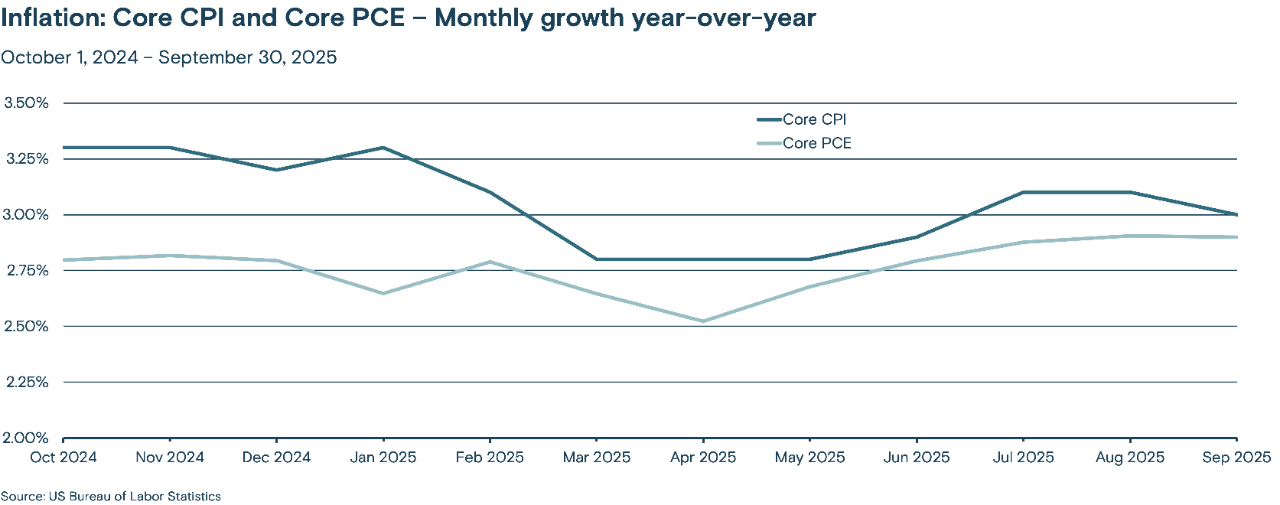
September’s Consumer Price Index (CPI) rose 3.0% relative to September 2024 — slightly less than expected. Core CPI (which excludes the more volatile food and energy sectors) rose 0.2% from August and 3.0% relative to September of last year, also lower than expected. While the details of the data provided some evidence that tariffs were putting upward pressure on prices, the impact has been less pronounced than most forecasters have expected. September’s Personal Consumption Expenditures (PCE) Price Index data was not released due to the government shutdown.
RELATED CONTENT
RELATED ARTICLE
2025 midyear outlook: Living with volatility
We don’t anticipate the market roller coaster will get less bumpy in the second half of 2025.
RELATED PODCAST
Will market volatility persist through the rest of 2025?
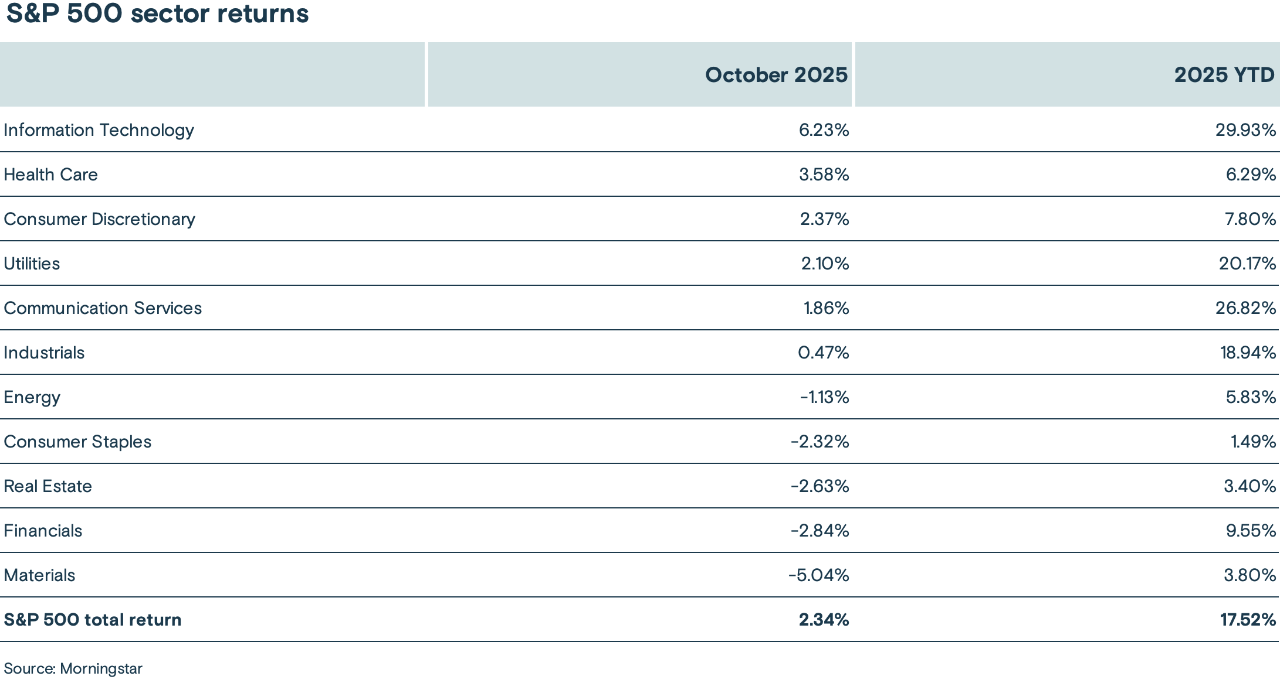
U.S. stocks rose again in October, with the benchmark S&P 500 Index of large-cap stocks increasing 2.27%, boosting its year-to-date gain to 16.30%. While there was intra-month volatility, primarily driven by renewed trade tensions, the S&P 500 Index was supported by strong corporate earnings. By month end, 82% of companies that had reported exceeded consensus revenue expectations. Performance in the S&P 500 Index was mixed, with substantial gains in information technology (up 6.23%), while the more interest-rate-sensitive real estate and financial sectors generated losses of -2.63% and -2.84%, respectively.
The table below shows the past month and year-to-date performance results of the 11 sectors:
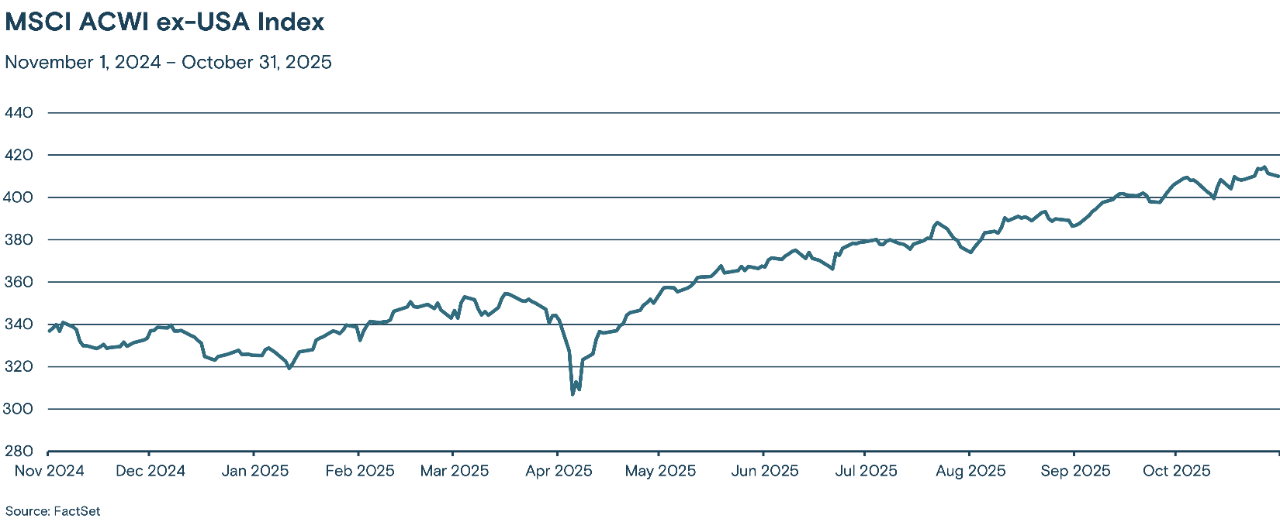
The MSCI ACWI ex-USA Index, which tracks stocks across developed and emerging-market economies across the world (excluding the U.S.), rose 1.95% in October, underperforming the S&P 500 Index. Japanese equities were relatively strong, driven by expectations for more expansionary policies from the incoming administration and yen weakness over the period. European stocks (excluding the U.K., which generated relatively strong performance) were more subdued, weighed down by ongoing political uncertainty in France. Year to date, the MSCI ACWI ex-USA Index is up 25.81%.
Benchmark 10-year Treasury yields ended October at 4.09%, 0.06% below their yield at the end of September, though yields fell below 4.0% for an extended period during the month. As was widely expected, the Fed cut its monetary policy rate by 0.25% near the end of the month. However, Fed Chairman Jerome Powell subsequently signaled that the chances for an additional cut at its December meeting were lower than the market had expected, pushing yields on shorter-dated Treasury securities higher.
Investment-grade and high-yield (sub-investment-grade credit ratings) corporate bonds saw modest spread widening in October. Two high-profile corporate bankruptcies from auto parts maker First Brands Group and car dealership TriColor Holdings weighed on investor sentiment. The Bloomberg U.S. Aggregate Bond Index, which has a significant allocation to investment-grade corporate bonds, rose 0.62% in October, boosting its year-to-date gain to 6.80%.
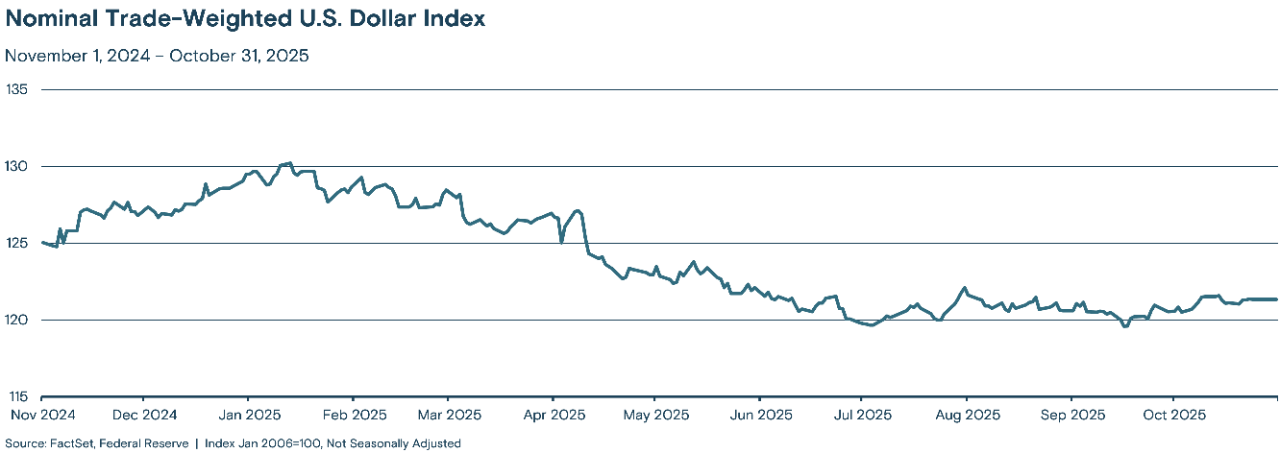
The Nominal Trade-Weighted U.S. Dollar Index rose 0.65% in October, though it remained within the range established over the summer. Lower interest rates (which typically put downward pressure on the currency) were broadly offset by less uncertainty in trade policy, which had weighed on the U.S. dollar earlier in the year. Year to date, the trade-weighted U.S. dollar has fallen by 6.29%.
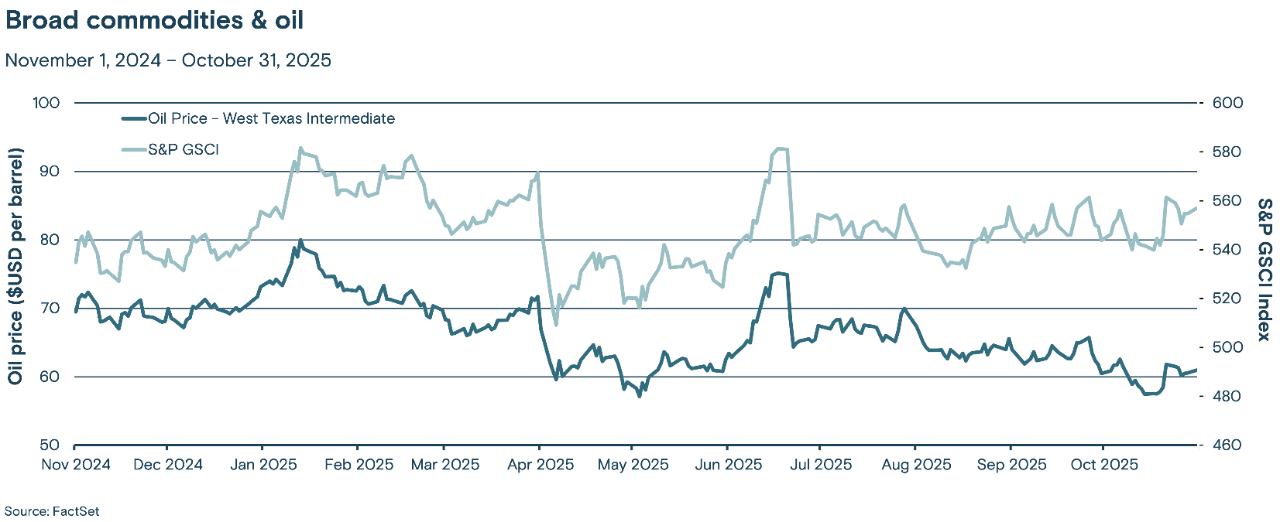
The S&P GSCI Index (a broad-based and production-weighted index representing the global commodity market) rose 1.28% in October. Gold prices continued to rise, partly due to lower interest rates, while energy prices remained generally lower. The cost of a barrel of West Texas Intermediate (a grade of crude oil used as a benchmark in oil pricing) fell 2.23% over the month, bringing its year-to-date decline to -14.97%.
Media contact: Callie Briese, 612-844-7340; callie.briese@thrivent.com
All information and representations herein are as of 11/07/2025, unless otherwise noted.
The views expressed are as of the date given, may change as market or other conditions change, and may differ from views expressed by other Thrivent Asset Management, LLC associates. Actual investment decisions made by Thrivent Asset Management, LLC will not necessarily reflect the views expressed. This information should not be considered investment advice or a recommendation of any particular security, strategy or product. Investment decisions should always be made based on an investor's specific financial needs, objectives, goals, time horizon, and risk tolerance.
This article refers to specific securities which Thrivent Mutual Funds may own. A complete listing of the holdings for each of the Thrivent Mutual Funds is available on thriventfunds.com.
The S&P 500® Index is a market-cap weighted index that represents the average performance of a group of 500 large-capitalization stocks.
The Russell 2000® Index is an unmanaged index considered representative of small-cap stocks.
The Nasdaq Composite Index is a stock market index that includes almost all stocks listed on the Nasdaq stock exchange. The Nasdaq – National Association of Securities Dealers Automated Quotations – is an electronic stock exchange with more than 3,300 company listings.
The MSCI ACWI ex-USA Index is an unmanaged index considered representative of large- and mid-cap stocks across developed and emerging markets, excluding the U.S.
The Bloomberg U.S. Aggregate Bond Index is an unmanaged index considered representative of the U.S. investment-grade, fixed-rate bond market.
The Federal Funds effective rate is the interest rate at which depository institutions (mainly banks) lend reserve balances to other depository institutions overnight on an uncollateralized basis. In simpler terms, it's the rate banks charge each other for short-term loans to meet their reserve requirements.
The Consumer Confidence Index (CCI) is a survey administered by the Conference Board. The CCI measures what consumers are feeling about their expected financial situation, whether that's optimistic or pessimistic.
The University of Michigan Consumer Sentiment Index is a consumer confidence index published monthly by the University of Michigan.
The Consumer Price Index measures the monthly change in prices paid by U.S. consumers for a basket of goods and services.
The Core Consumer Price Index (CPI) measures changes in the prices of goods and services, with the exclusion of food and energy.
The Personal Consumption Expenditures (PCE) Price Index, also known as consumer spending, is a measure of the spending on goods and services by people of the U.S.
The Core Personal Consumption Expenditures (PCE) Price Index, also known as consumer spending, is a measure of the spending on goods and services, excluding food and energy prices, by people of the U.S.
The Nominal Trade-weighted U.S. Dollar Index measures the value of the U.S. dollar based on its competitiveness versus trading partners.
The Institute for Supply Management Purchasing Managers Index (PMI) measures the month-over-month change in economic activity within the manufacturing sector.
Any indexes shown are unmanaged and do not reflect the typical costs of investing. Investors cannot invest directly in an index.
Past performance is not necessarily indicative of future results.
The Chicago Purchasing Managers’ Index determines the economic health of the manufacturing sector in the Chicago region.
The Automatic Data Processing (ADP) employment report measures the monthly change in private sector employment.