Now leaving ThriventFunds.com


You're about to visit a site that is neither owned nor operated by Thrivent Asset Management.

In the interest of protecting your information, we recommend you review the privacy policies at your destination site.

Financial Professional Site Registration

Complete this form to get full access to the entire financial professional site.

By clicking “Register”, you agree to our privacy and security policies and that you are a financial professional.

Access will be granted immediately, but the registration process may take up to 5 business days to complete.

Thank you for registering

You can now enjoy all financial professional content.

If your download does not start automatically, click here.

An error occurred

Please check back later.

CAPITAL MARKETS PERSPECTIVE: Q4 2026

Growth and stocks remain resilient, but rates rise

10/07/2026 - Written by Steve Lowe, CFA

CAPITAL MARKETS PERSPECTIVE: Q4 2026

Growth and stocks remain resilient, but rates rise

10/07/2026 - Written by Steve Lowe, CFA

Key points

Interest rates

Expected to remain higher for longer

Economic growth

AI investments supporting healthy growth

Credit

Attractive bond yields support a focus on high-quality credit

Inflation

Higher oil prices are pressuring inflation

Capital Markets Perspective:
A look ahead

The economy continues to grow at a solid rate, supported by the large artificial intelligence (AI) investment cycle, a resilient consumer, productivity gains and lower tax rates and tax law changes that have supported business investment. However, consumption has been supported by the upper income tiers, and there are signs of consumption slowing, while disposable income has not kept pace with inflation since the COVID-19 pandemic.

We expect overall economic growth to remain healthy but will continue to monitor developments in the Middle East and potential supply chain disruptions resulting from the ongoing conflict. Domestically, it remains unclear whether companies investing heavily in AI can monetize their investments and increase earnings enough to justify high valuations. While competition, including AI models emerging from China, is a growing risk, both sales and earnings from U.S. AI companies have been strong. Looking ahead, we expect AI to remain the market's driving force, given our expectation of continued earnings growth potential by AI leaders and more companies demonstrating increased efficiency through AI adoption.

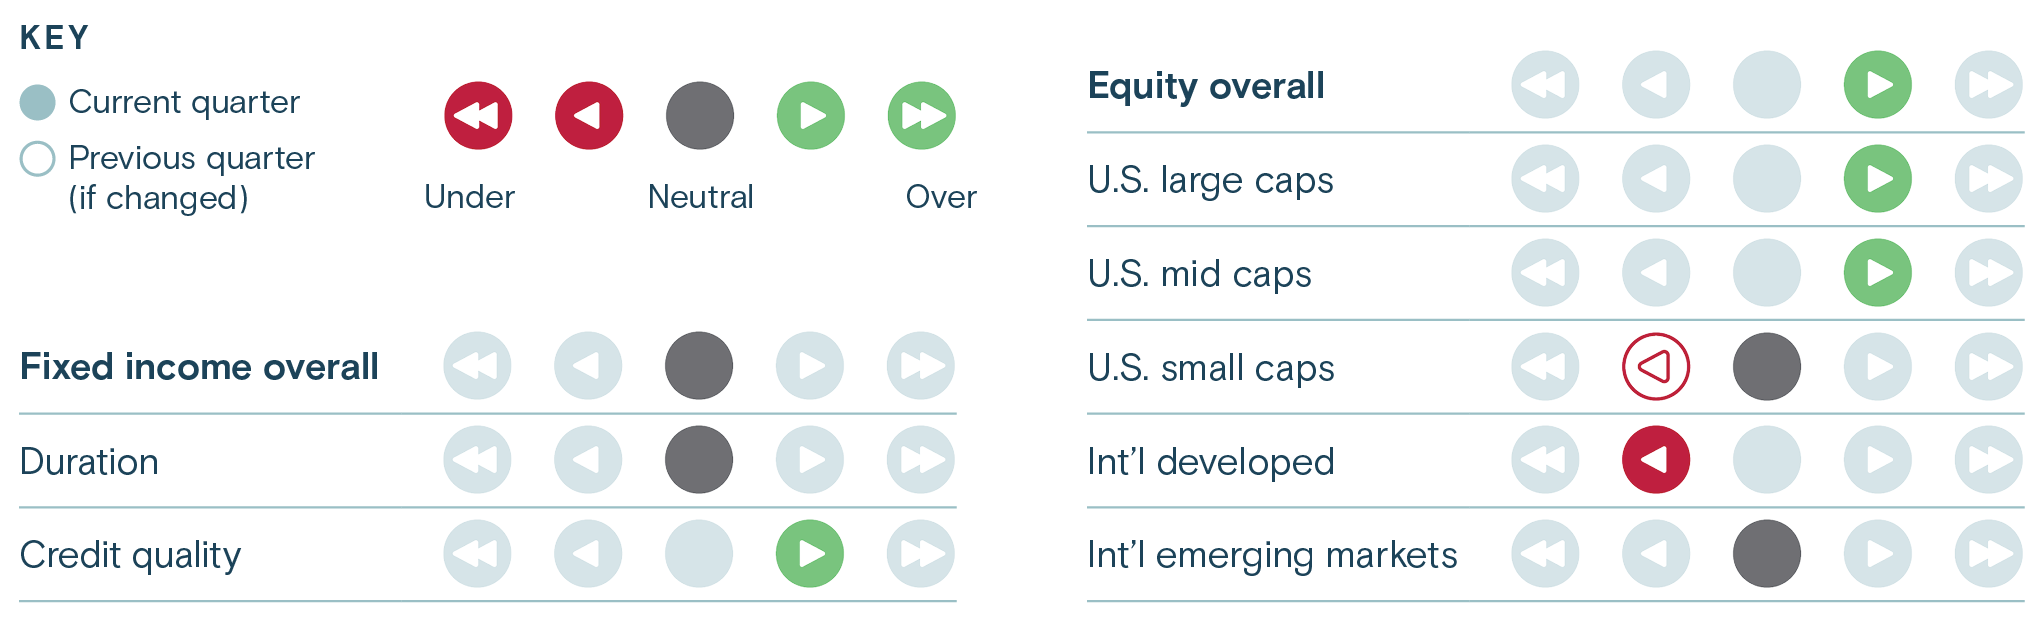
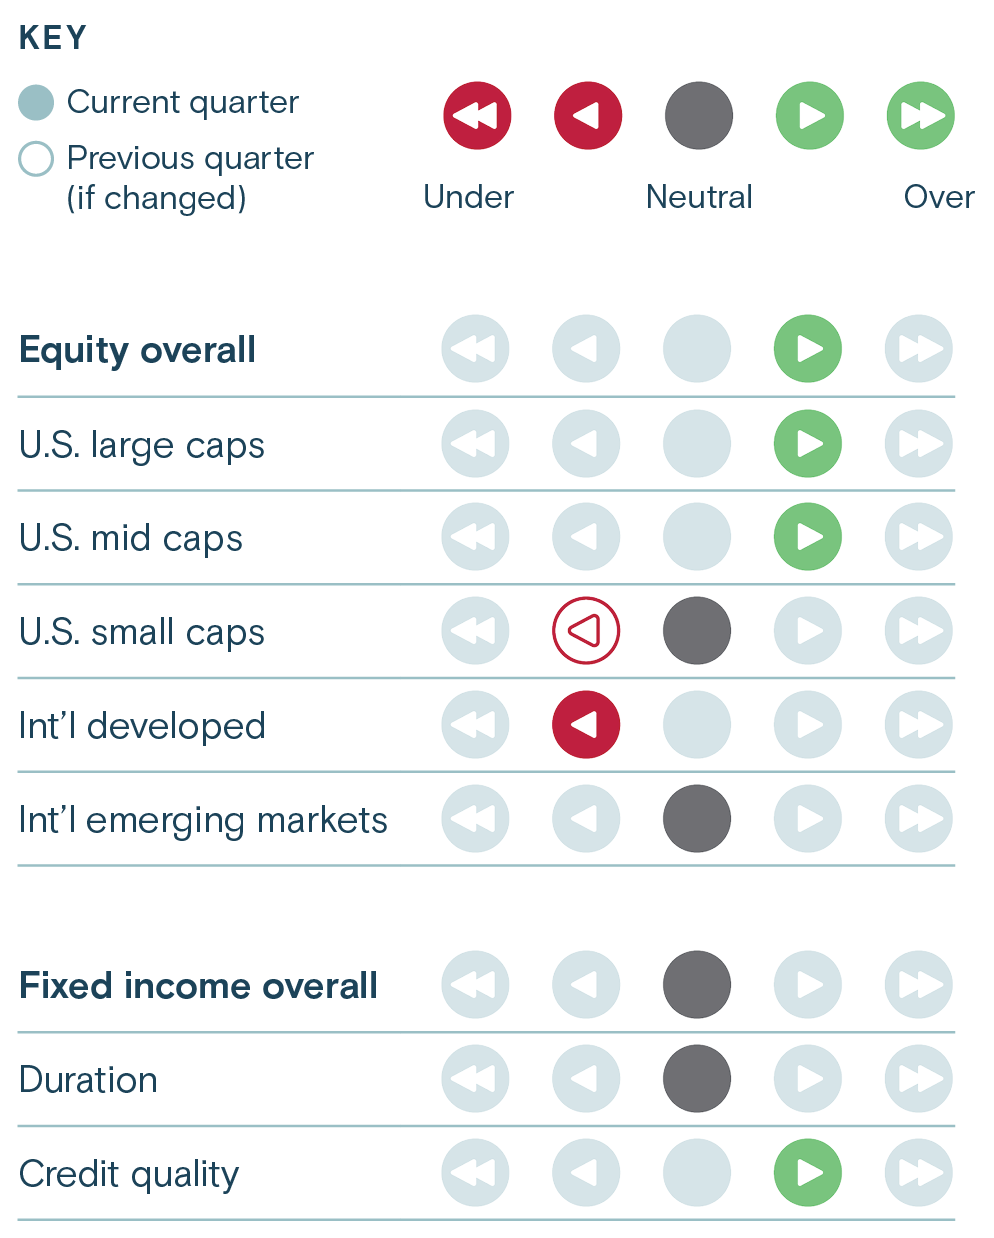
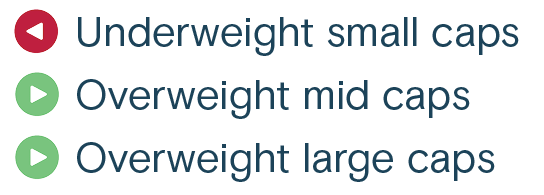
In this environment, we remain moderately overweight U.S. equities and overweight large-cap stocks. Including our private equity allocations, we are roughly neutral to small-cap and mid-cap stocks. We remain underweight developed international stocks and neutral in our exposure to emerging-market stocks. Looking back, market breadth narrowed over the third quarter, with large-cap growth stocks moderately outperforming value stocks and cyclical stocks slightly outperforming more defensive stocks. While we remain overweight growth stocks, we do expect moderate broadening of the market’s performance into value stocks on the back of sustained economic growth.

The U.S. Federal Reserve (Fed) raised interest rates by 0.25% in September, and we expect a further 0.25% rise before year end and possibly another 0.25% hike if inflation remains elevated. Looking ahead, we expect interest rates to remain higher than they have been in the past 25 years given solid growth, higher inflation, concerns about debt levels and sustained competition for capital from AI-related companies eager to build out additional capacity.

Treasury bond yields rose over the quarter, accelerating in September, on the back of solid economic growth, persistent inflation, concerns about the Federal budget deficit and rising U.S. debt relative to gross domestic product (GDP). However, current yield levels for Treasuries, investment-grade corporate bonds and other fixed-income instruments are very attractive for long-term holdings. As such, we remain roughly neutral in our interest-rate exposure, with a small overweight in longer-dated Treasuries given their high absolute yields and their ability to act as a hedge should equity markets sell off significantly.

A resilient economy supports a modest equity overweight, while attractive yields reinforce the value of maintaining exposure to high-quality fixed income.

Quarterly highlights

Energy influencing inflation

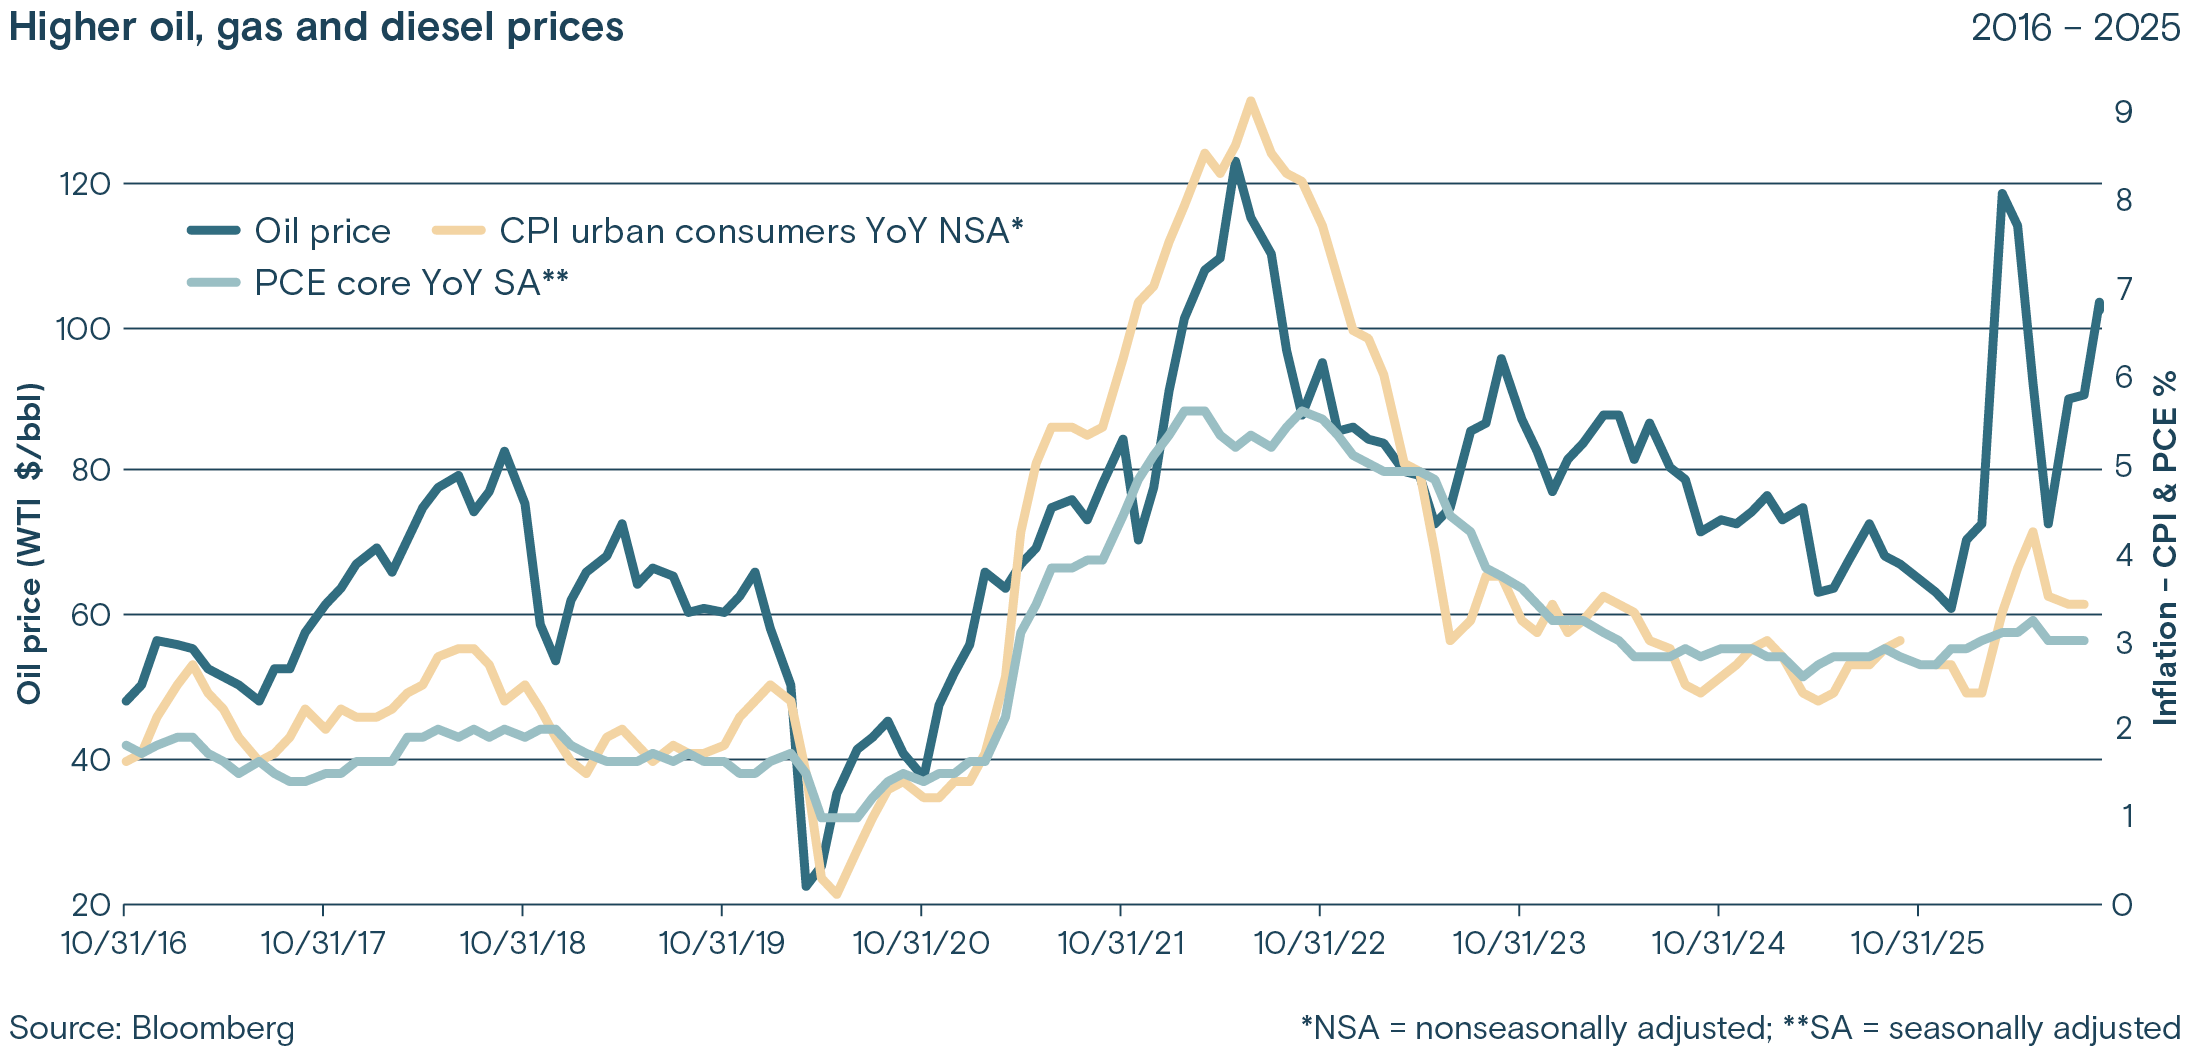
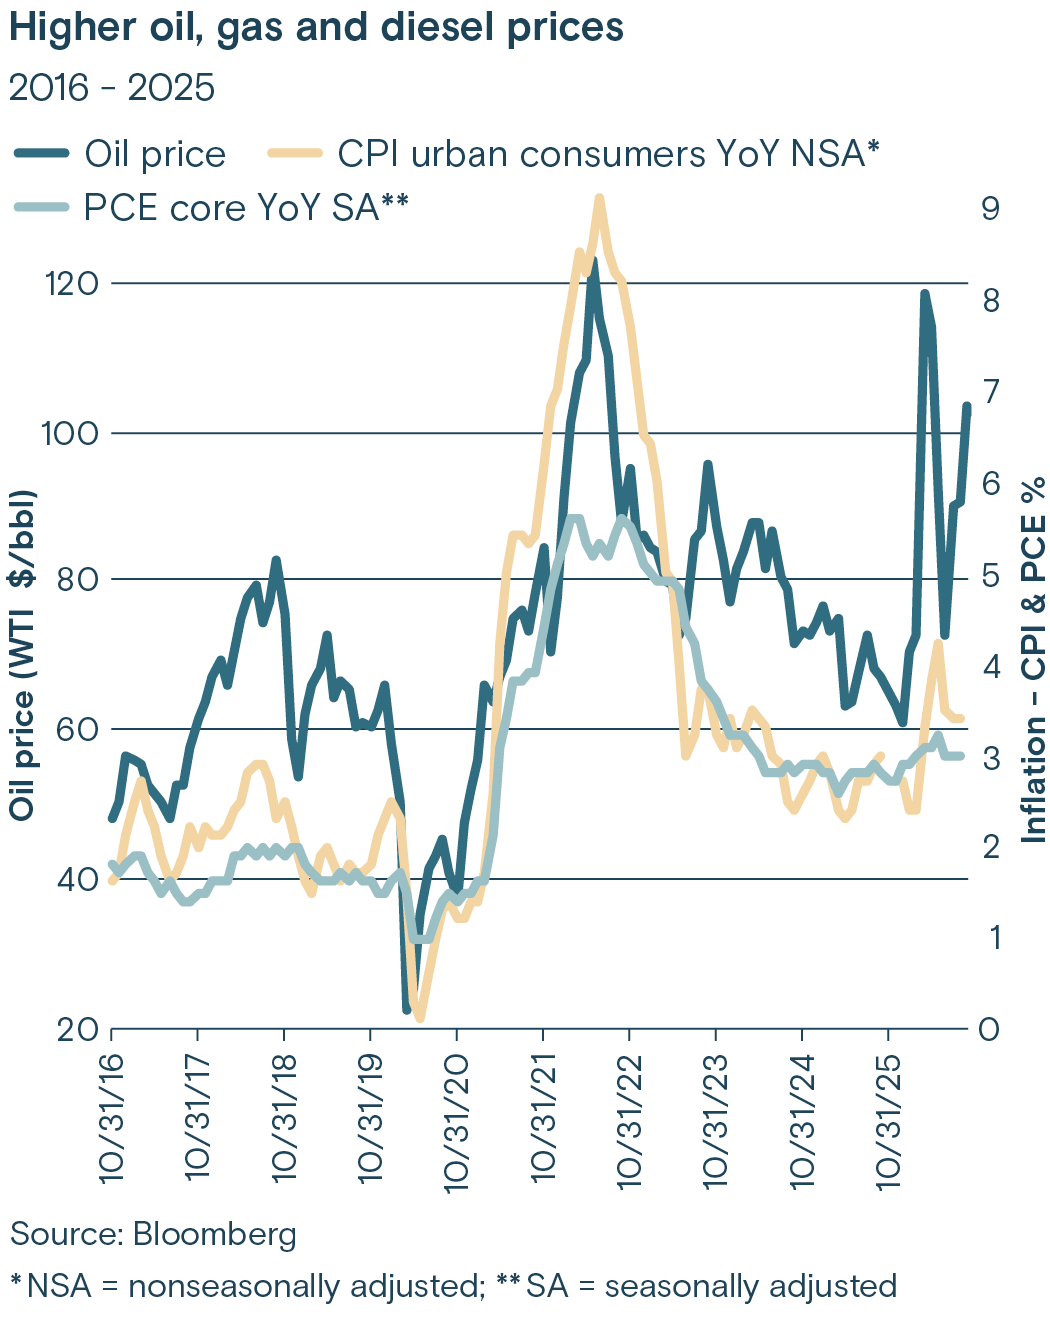
Higher oil, gas and diesel prices 2016-2025

Energy prices shot up with the conflict in the Middle East and resulting widespread supply chain disruptions. Higher oil, gas and diesel prices in turn pushed up consumer inflation despite the economy’s thirst for oil declining over time. Energy makes up about 7% of the consumer price index (CPI) versus roughly 11% in the early 1980s.

Energy prices, however, still heavily influence inflation despite the economy and consumers consuming less oil, gas and other energy products. While there is a direct connection between overall inflation and energy prices, the Federal Reserve prefers to focus on so-called core inflation, which excludes energy and other volatile measures. The rationale is that energy prices can fluctuate widely depending on global supply factors and geopolitical events that are largely outside the control and influence of monetary policy.

However, oil and other energy prices seep into core inflation for the simple reason that energy is an input into nearly every product. Sometimes it’s directly, such as with oil-based plastics along with fertilizers, which use nitrogen derived from natural gas. Also, diesel is critical for transportation and farming equipment. Natural gas is needed to heat many buildings and homes. Oil prices (particularly gas prices) also heavily influence consumer confidence and inflation expectations. They tend to be much higher than actual inflation but can impact inflation if consumers pull forward buying to beat price increases, and if companies take advantage of higher inflation expectations to increase prices.

So, while core inflation is less correlated with oil prices than the full consumer price index, energy costs still have a significant impact

Drivers of equity prices

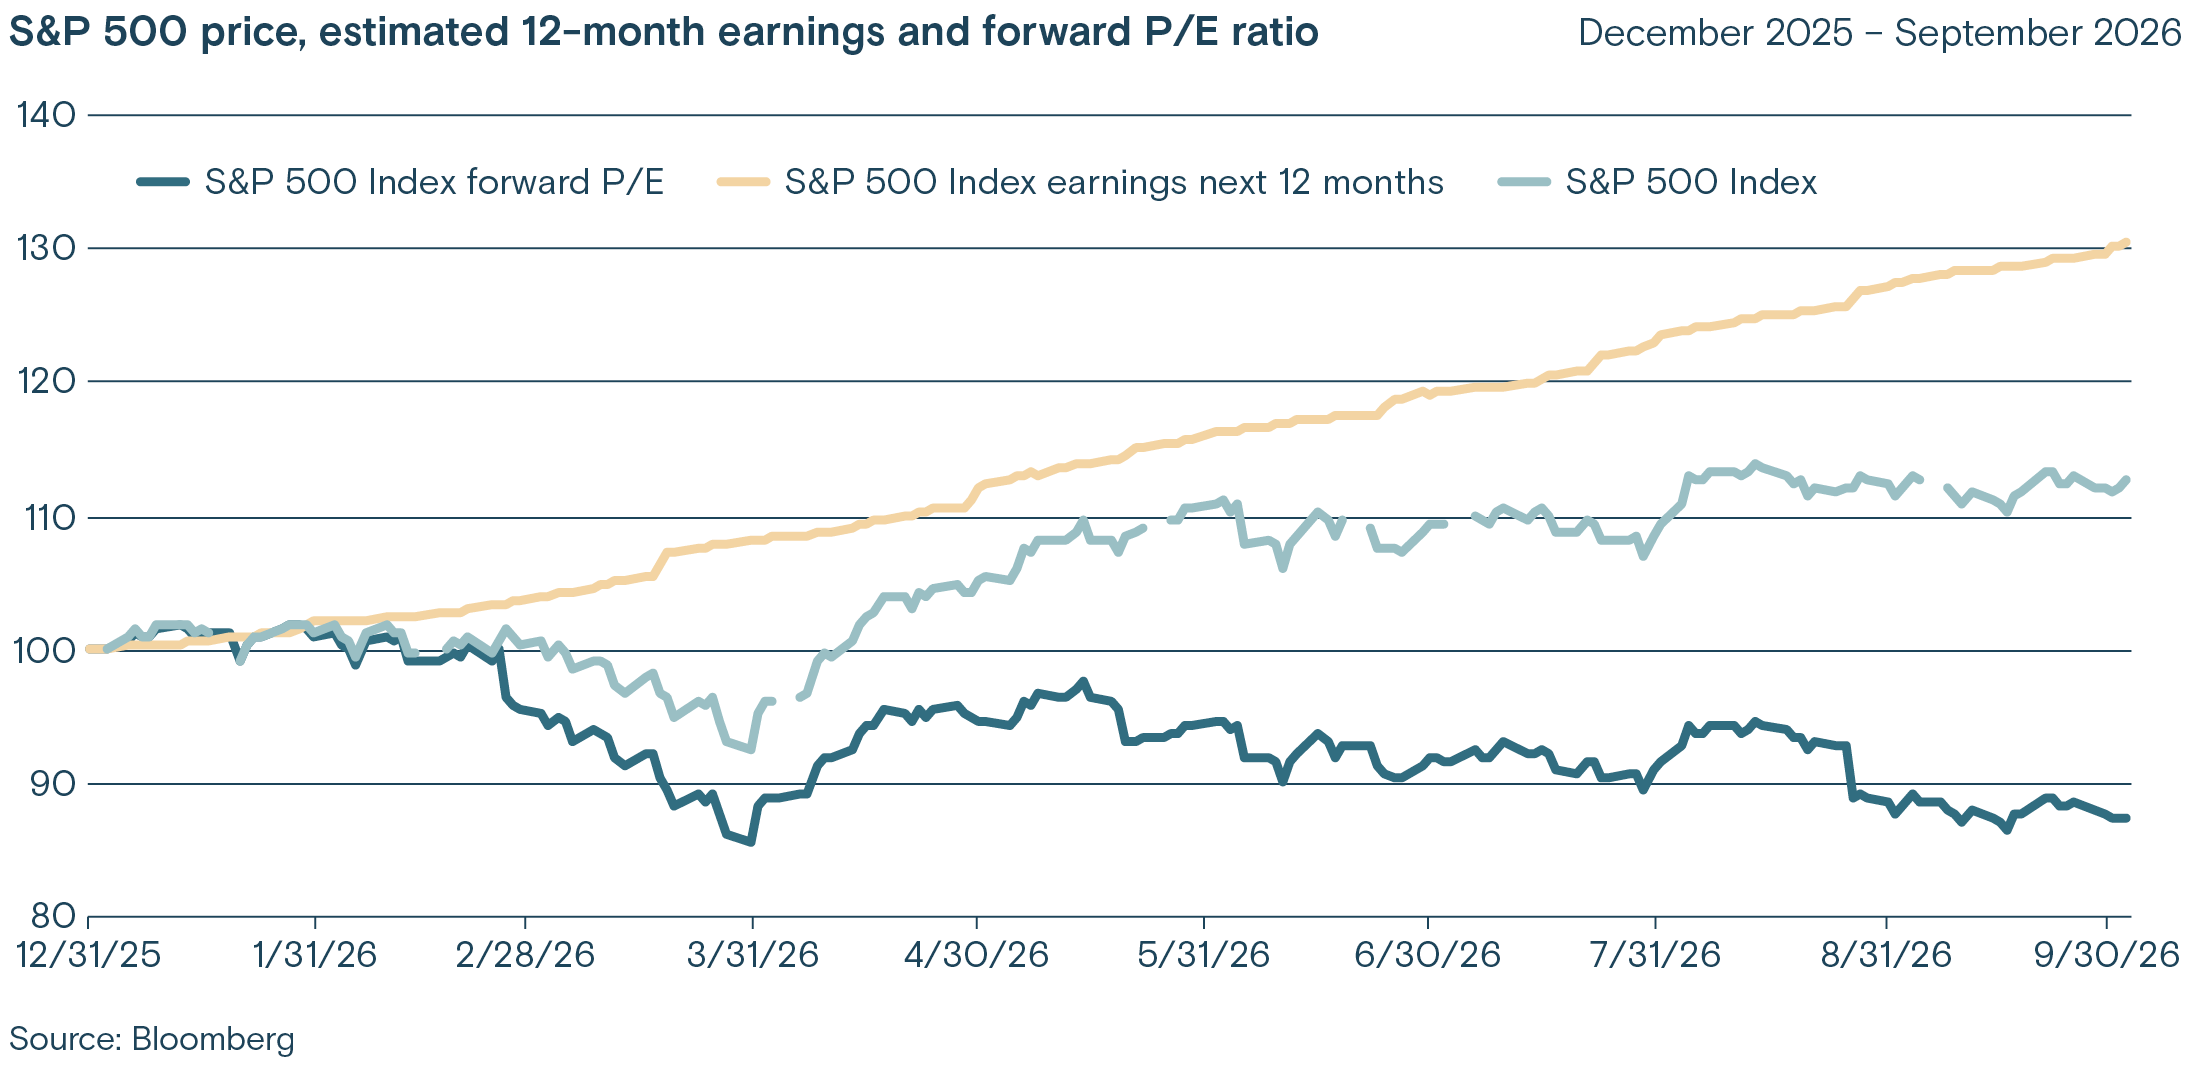
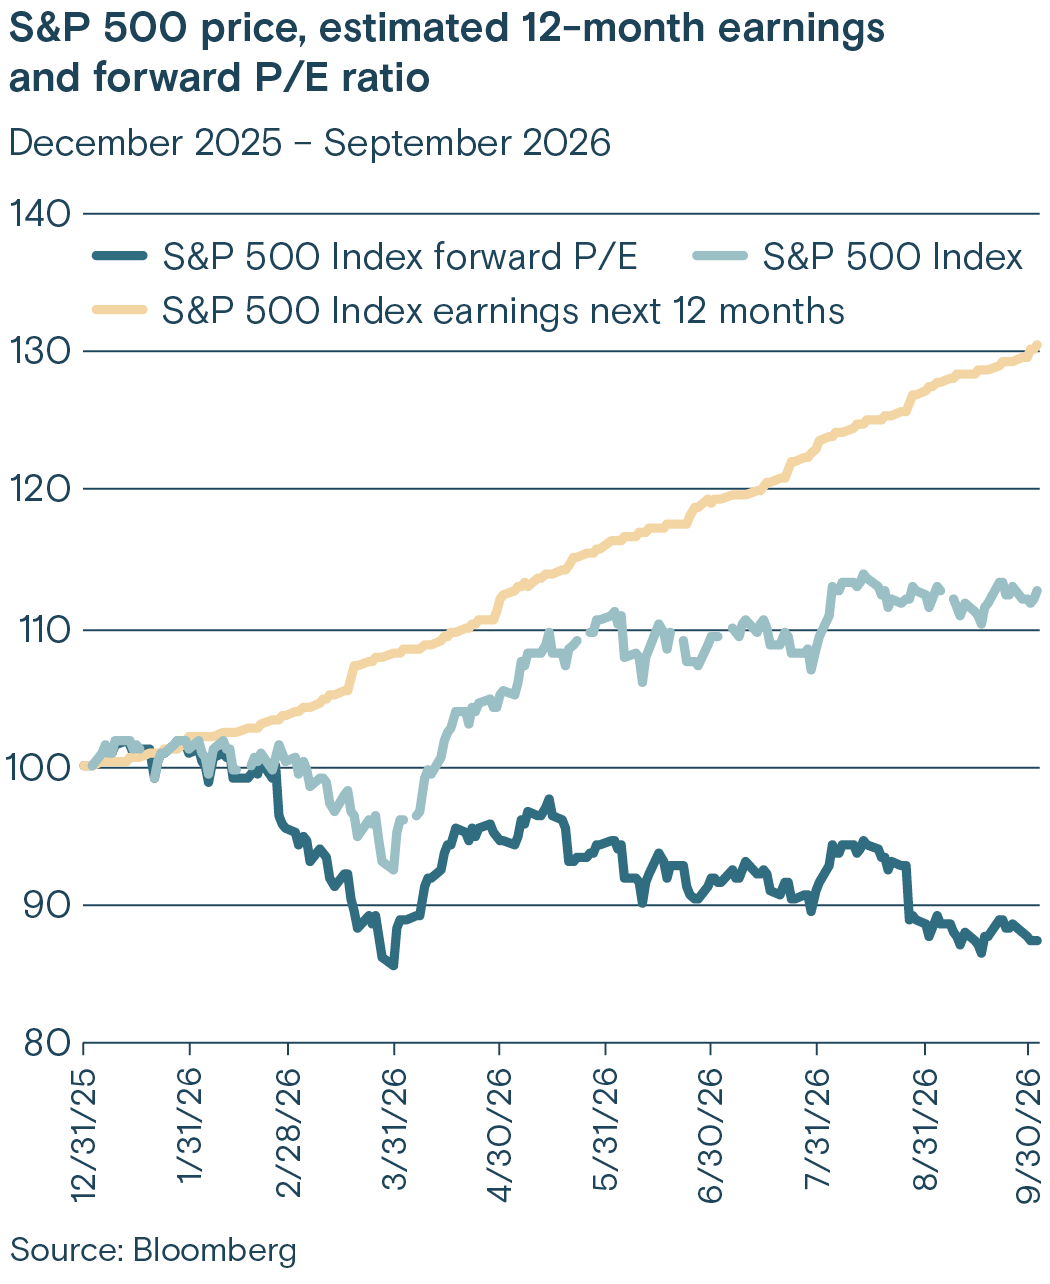
S&P 500 price, estimated 12-month earnings & forward P/E ratio

The S&P 500 Index® has faced multiple headwinds this year, including rising interest rates, geopolitical shocks, higher oil prices and continued trade friction.

Despite these headwinds, the index rose about 12% through the third quarter, powered by strong earnings, particularly related to AI leaders. Earnings revisions have been positive through most of year, meaning analysts have repeatedly revised their estimates higher for earnings.

Technology and particularly AI leaders have shown rapid earnings growth, with tech earnings up 76% in the second quarter, according to Factset. Artificial intelligence services and investments along with hardware spending account for about 50% of earnings growth so far. Energy companies also have posted strong results.

However, valuation multiples such as the price to earnings ratio have fallen. Part of the reason is that expected earnings growth has outpaced the index’s price increase, which mechanically lowers the price to earnings ratio as the denominator (earnings) rises faster than the numerator (price).

Rapid increases in Treasury rates also have lowered the P/E ratio, as they increase the discount rate applied to future earnings, making future earnings worth less today. Earnings should continue to support the market into next year, when earnings are projected to slow from the blistering pace this year but broaden and grow at a strong 15% pace on a 9% increase in sales.

Token volatility

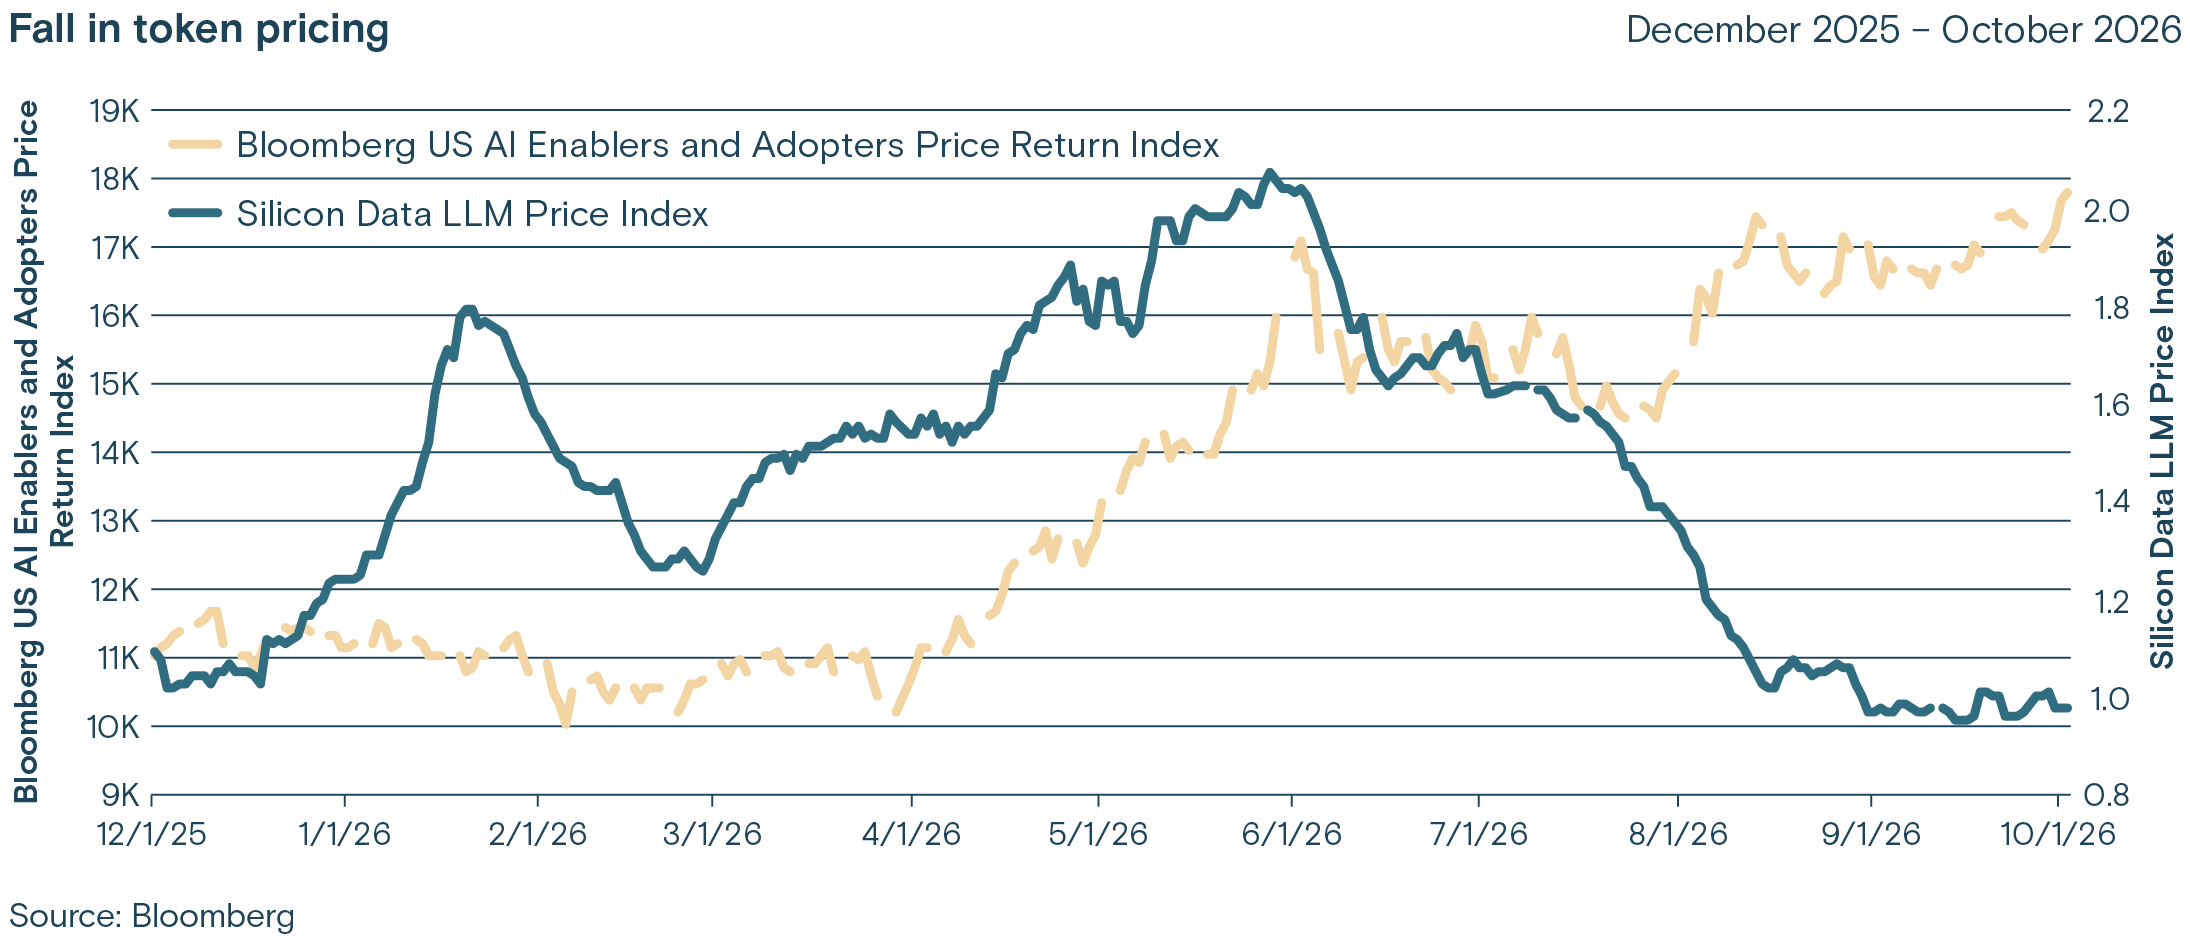
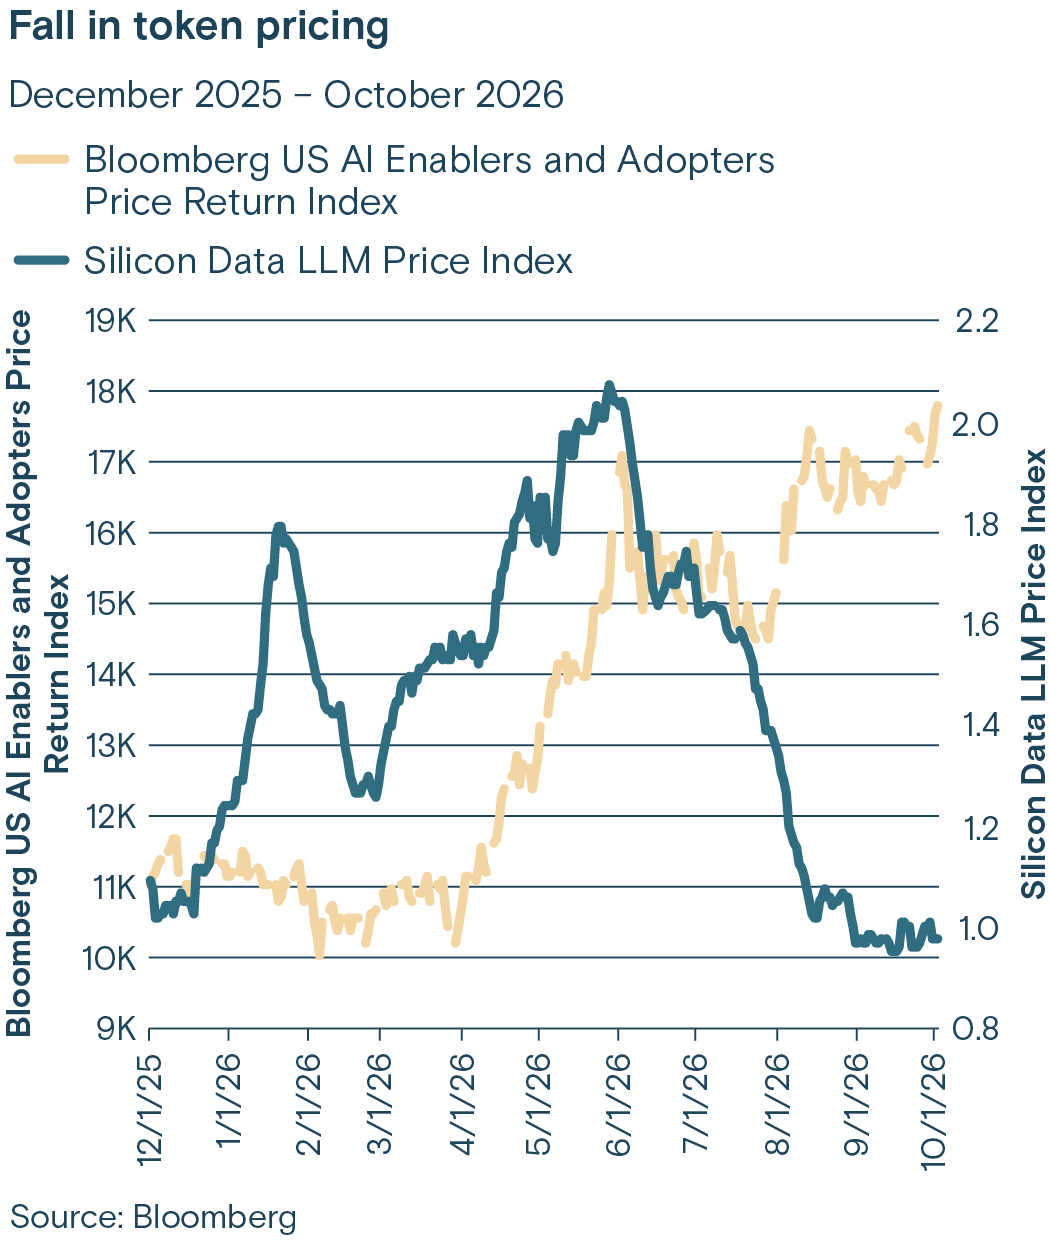
Fall in token pricing December 2025 - October 2026

The Silicon Data LLM Token Expenditure Index tracks demand and pricing for tokens, the basic unit of AI processing, and calculates the usage-weighted price of 1 million tokens across a defined LLM universe. It surged through May of this year before falling sharply through the summer, indicating a surge in usage of AI models followed by lower pricing, which in turn sparked greater demand.

LLM stands for large language models, which are the AI models many use daily, such as Anthropic’s Claude, OpenAI’s GPT series and Google’s Gemini. These AI models cut your input text into a sequence of fragments (tokens).

A token is a small piece of text, such as a word or part of a word, punctuation or a space. In English, one token is roughly four characters or 0.75 words.

The fall in token pricing highlights a structural shift in the AI economy as the market shifted from building and improving AI infrastructure to intense price competition. Bloomberg’s AI Enablers and Adopters index tracked the index closely, rising as token demand and pricing rose, before declining as pricing fell. The AI Enablers and Adopters index, however, started rising again, showing strong demand for AI models.

We expect continued strong demand for AI services. Key risks are if pricing falls further and demand falters enough such that AI leaders are unable to monetize the massive investments enough to sustain strong earnings and returns on the billions in capital expenditures. Our base case, however, is that demand for AI services remains robust.

Capex spending

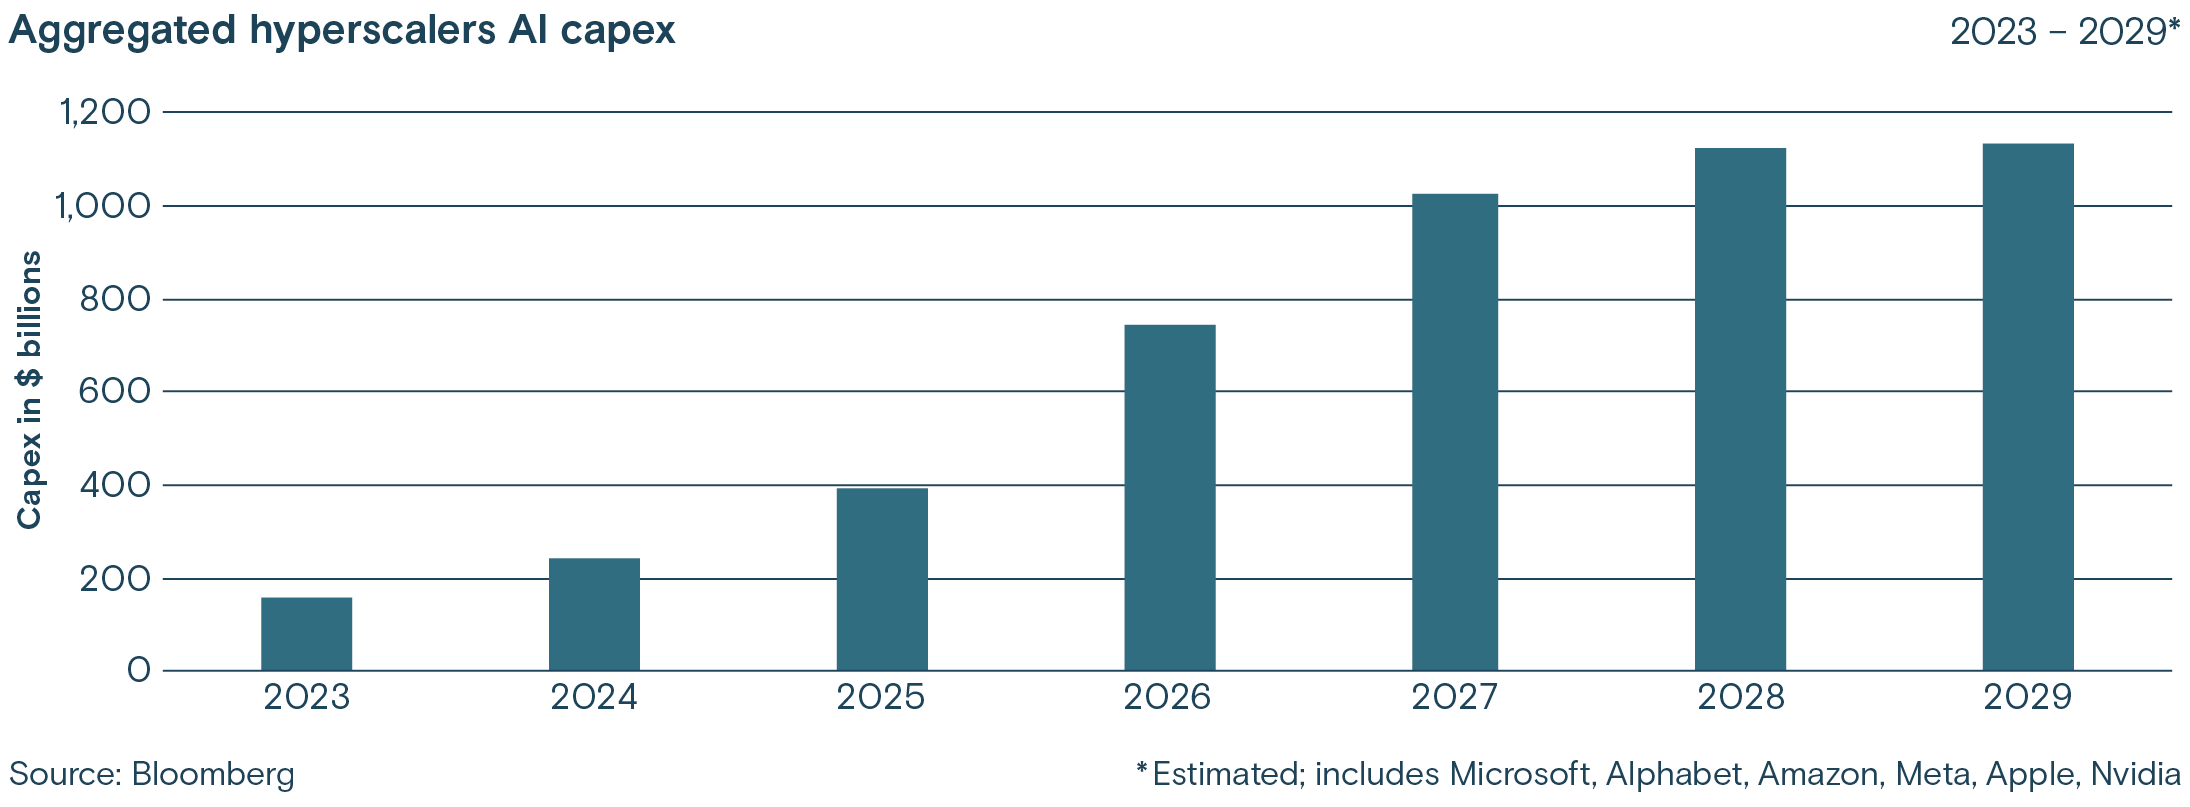
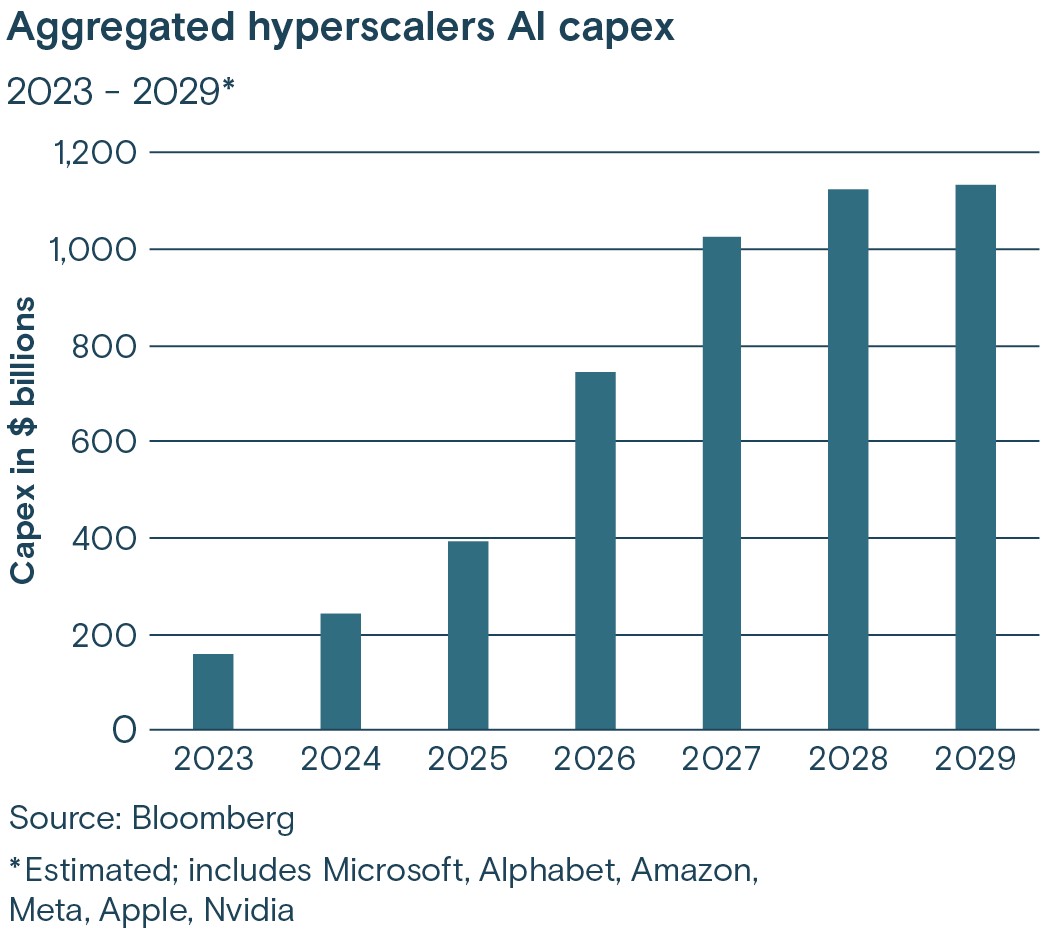
Aggregated hyperscalers AI capex 2023-2029

The artificial intelligence race has sparked a historic wave of capital spending that shows no sign of letting up. Capital spending by key AI leaders is expected to surge from around $800 billion this year to more than a trillion dollars in 2027. Estimates vary widely, with Morgan Stanley estimating more than $1.6 trillion of capex in 2028.

The key drivers of the AI capex boom are the so-called hyperscalers, including Alphabet, Amazon, Meta, Apple and sometimes others, such as Nvidia, Oracle and CoreWeave. To put the scale of spending in perspective, S&P Global estimates that eight years of AI capex spending through 2030 will exceed the prior 26 years of overall capital spending combined. And the Columbia Business School calculates that annual AI capital spending from 2025 through 2032 will total about 3.6% of U.S. Gross Domestic Product (GDP). For comparison, the tech bubble was at 1.1% of GDP.

The closest U.S. investment cycle in terms of scale of spending was railroads, at 2.2% of GDP annually from 1870 to 1890. Other estimates are a bit lower with AI capital spending at about 2% of GDP this year.

What is clear is that AI capex and data center construction are boosting economic growth materially. AI capital spending, however, is impacting hyperscaler balance sheets. At first, AI capex was largely paid out of operating cash flow, but as free cash flow declined due to high spending, more companies have increased leverage by issuing debt in the corporate bond market, private credit market and other credit markets to fund the buildout.

So far markets have absorbed the debt, but there are concerns that continued debt issuance would pressure credit spreads wider and possibly increase Treasury rates as long-term AI debt competes for investors’ cash.

It also adds a layer of risk to the AI buildout if hyperscalers and others are unable to monetize their AI investments and grow sales profitably enough to justify their high equity valuations and to meet their debt obligations.

So far, sales and earnings are growing rapidly, but technology can change rapidly and competition to lead AI is fierce.

Weighting positions

Thrivent asset class weighting key

Equity: Market cap

The middle of the year has seen the economy continue to strengthen. Consumer spending and business investment remain supportive, as retail sales, durable goods new orders and manufacturing sentiment have all made progress. Taken together, these trends suggest resilience undergirds the expansion.

As is frequently the case, however, there are reasons for caution. Consumer sentiment remains depressed, and housing activity continues to struggle with affordability. Labor has softened but remains reasonably stable. The most recent labor report put the three-month average job gains at approximately 50,000. Given the present labor-market dynamic, this is an acceptable level which does not obviously threaten the existing supply/demand relationship nor does it represent evidence of an overheating economy. At the same time, it doesn’t exactly represent strength, either.

Equities present a more complicated picture. The economy can continue to expand, even as stock prices adjust to more demanding expectations. Following the rally from the first-quarter lows, the S&P 500 Index and large growth leadership have spent the summer months moving sideways. While this consolidation could provide a foundation for renewed appreciation, a trading range alone does not establish that the next meaningful move will be higher.

Our concerns are not unique. The market’s growing dependence on a handful of names connected to the AI trade confers an obvious measure of fragility, and one that has drawn increasing attention. Questions about spending, eventual investment returns and the technology’s broader risks could undermine confidence in the companies supporting both index performance and earnings expectations. Even a change in sentiment (especially if voiced by industry executives) prior to softer profit projections could trigger a rapid reassessment of valuations.

Small- and mid-size companies, value stocks and even the equal-weight S&P 500 have already struggled. All of these categories limped through the last six weeks of Q3, highlighting how headline index resilience—cap-weighted indices in particular—can conceal deteriorating participation. If AI leadership falters, near-term weakness will likely follow.

Though both the prospect of a decline and its potential catalyst remain uncertain, the Fed’s next steps, headlines involving Iran, a disappointing earnings season or the market’s reaction to November’s midterm elections could each spark a period of weakness. While we remain broadly positive on both the domestic economy and the equity market outlook, we have recently chosen to trim equity exposure slightly. Despite this reduction, we maintain a modest equity overweight within the Asset Allocation funds.


Equity: U.S. vs. international

The S&P 500 outperformed developed international equities by about 2% in Q3 and essentially matched them over the past year. Relative to emerging market equities, the S&P 500 outperformed by 2% in Q3 but trailed by 15% over the past year.

We maintain an overweight to domestic equities, a modest underweight to developed international markets primarily via the Eurozone, and a neutral allocation to emerging markets. Structural challenges in the Eurozone remain intact, including unfavorable demographics, higher regulatory burdens and lower levels of innovation and investment.

Near-term conditions are also challenging, as higher energy prices continue to pressure the region’s relatively large manufacturing sector, fixed investment remains subdued and France faces worsening fiscal conditions and political uncertainty.

At the same time, we recognize the significant role the AI theme has played in supporting U.S. equity performance and the potential for volatility if expectations for AI monetization change.

As a result, our underweight to developed international equities remains modest, and we continue to wait for a more compelling opportunity to expand our underweight position. Our neutral positioning in emerging markets reflects a balance between the potential durability of the rally in AI infrastructure and the elevated risk of a meaningful reversal.


Equity: Market cap

Large caps, as measured by the S&P 500, outperformed the Russell 2000 Index by nearly 10% in Q3 and delivered similar returns over the past year. As expected, this marked a sharp reversal from Q2 and the 12 months ended June 30, when small caps and lower-quality, less profitable companies significantly outperformed.

We believe leadership is likely to remain with higher-quality large caps. Historical evidence suggests that strong periods of large-cap outperformance are not typically followed by mean reversion, leaving small caps facing headwinds.

Higher interest rates are more problematic for small caps, which generally carry more leverage and rely more heavily on short-term financing and floating-rate debt. Furthermore, we continue to believe that the ability of smaller, fast-growing companies to remain private for longer (enabled by deep private markets) creates a structural advantage for large caps in public markets. As a result, we remain underweight public small caps and overweight large caps domestically, and our private equity allocation is concentrated in smaller companies.


Fixed income: Duration & rates

Interest rates rose across the length of the Treasury curve in the third quarter. The Federal Reserve increased its target rate in September for the first time since 2023, raising the Fed Funds rate by 0.25% to a target range of 3.75-4%. Markets proceeded to price in an extended Fed hiking cycle with nearly four more 0.25% hikes through 2027 to combat inflation. The number of hikes was lowered to three through 2027 after a softer than expected payroll report for September.

Treasury rates have risen sharply this year across the curve with short rates up the most and long-term rates rising significantly but less so than 2-year rates. Several factors pushed rates higher. The Fed’s favorite inflation measure, the core Personal Consumption Expenditures (PCE) price index, has been higher than the Fed’s 2% target since 2021. Core PCE excludes volatile elements such as food and energy, but persistently high energy prices can bleed into the prices of broader goods and services as they push up input costs.

Higher inflation expectations also lifted rates along with a larger term premium, which is compensation for risks such as rising deficits, increased supply of Treasuries, inflation uncertainty, liquidity and volatility. The massive capital-intensive buildout of AI is fueling inflation with rate-insensitive spending. AI companies are also competing with Treasuries with large-scale, long-duration debt issuance, which pressures rates higher. The largest driver of longer-term rates, however, has been real rates, which are nominal rates minus the expected inflation rate. Real rates are driven primarily by growth, central bank policy and global capital flows.

Looking ahead, we expect the Fed to hike rates once more this year and likely once in 2027 with a chance of a second hike depending on inflation. We also expect long-term rates to remain at a high level given strong economic growth, continued hyperscaler debt issuance and concerns about fiscal sustainability.

However, should long-term interest rates rise significantly more, the resulting tightening in financial conditions likely would slow growth, which would pressure long-term rates lower.

We are positioned roughly neutral with regard to duration and positioned for a flatter yield curve, with an underweight on the short-end of the Treasury curve due to a hawkish leaning Fed. We are roughly neutral overall as hedge for a risk-off move in markets.


Fixed income: Credit quality

Fixed-income credit spreads widened moderately in the third quarter after tightening in the previous quarter. Continued uncertainty due to the Mideast conflict, higher energy costs and a surge of issuance to fund the AI spending boom pressured spreads wider.

Investment-grade corporate spreads increased slightly while both higher-yield corporate spreads and emerging markets debt spreads increased meaningfully. Spreads, however, remained well below the long-term median level.

Year-to-date investment-grade credit spreads are moderately wider while emerging markets debt spreads are roughly unchanged. High-yield spreads are moderately wider, however, due in part to concerns over the impact of artificial intelligence on the software sector and steadily increasing debt loads in the technology sector to fund artificial intelligence. Credit spreads are the increased yield over Treasuries in corporate and other bonds for risks such as default, liquidity and volatility.

Despite recent widening, high-yield spreads entered the fourth quarter in the richest quartile of long-term historical levels while investment-grade spreads were in the richest decile. Relatively tight spread levels are supported by a strong economic outlook, strong demand for credit and still solid fundamentals. The main threat to fundamentals is increasing debt loads to fund capital spending.

While spreads are relatively tight, yields are at very attractive levels given the rise in Treasury rates. Flows into credit products are strong given higher yields. Total returns in the third quarter, however, were broadly negative, with investment-grade corporates returning -3.9% and emerging markets debt posting a -4.3% return. High-yield bonds, which generally have less sensitivity to rate moves than investment-grade bonds, outperformed with a return of -1.8%.

Looking ahead, we expect credit to remain under pressure despite a growing economy and strong earnings. Continued high debt issuance to fund the build out of AI could pressure credit spreads wider with estimates of 2026 capital spending from the leading AI large-cap companies running as high as $900 billion this year and up to $1.4 trillion in 2027.

While credit markets so far have absorbed the new debt with only moderate spread widening, concerns are increasing over the stress from higher interest rates, higher debt levels and deteriorating fundamentals due to capital spending absorbing more of operating cash flow. The key risk is if AI fails to generate enough revenue to justify the high level of capital spending.

Also, continued conflict in the Persian Gulf remains a risk to oil markets and credit quality.

We remain moderately overweight credit given attractive yields, favoring higher-quality credit, such as securitized credit, investment-grade emerging markets bonds, investment grade corporates and BB-rated high yield corporates. We also favor collateralized loan obligations (CLOs) over leveraged loans. We are underweight lower-quality credit, such as leveraged loans and high yield, which have weaker fundamentals and would be pressured more by higher interest rates.

 

The authors

Thrivent fund manager - Stephen Lowe, Chief Investment Strategist

WRITTEN BY:

Stephen D. Lowe, CFA

Chief Investment Strategist

Thrivent Asset Management contributors to this report: David Spangler, CFA, Head of Model & Mixed Asset Portfolios; Kent White, CFA, Head of Fixed Income Investments; and John Groton, Jr., CFA, director of administration and materials & energy research

Thrivent fund manager - Stephen Lowe, Chief Investment Strategist

WRITTEN BY:

Stephen D. Lowe, CFA

Chief Investment Strategist

Thrivent Asset Management contributors to this report: David Spangler, CFA, Head of Model & Mixed Asset Portfolios; Kent White, CFA, Head of Fixed Income Investments; and John Groton, Jr., CFA, director of administration and materials & energy research

Media contact: Callie Briese, 612-844-7340; callie.briese@thrivent.com

Past performance is not necessarily indicative of future results.

All information and representations herein are as of 10/07/2026, unless otherwise noted.

The views expressed are as of the date given, may change as market or other conditions change, and may differ from views expressed by other Thrivent Asset Management, LLC associates. Actual investment decisions made by Thrivent Asset Management, LLC will not necessarily reflect the views expressed. This information should not be considered investment advice or a recommendation of any particular security, strategy or product. Investment decisions should always be made based on an investor's specific financial needs, objectives, goals, time horizon, and risk tolerance.

Any indexes mentioned are unmanaged and do not reflect the typical costs of investing. Investors cannot invest directly in an index.

This article refers to specific securities which Thrivent Mutual Funds and Thrivent ETFs may own. A complete listing of the holdings for each of the funds is available on thriventfunds.com.

The Bloomberg U.S. AI Enablers and Adopters Price Return List is a thematic equity index that tracks the performance of the top 20 companies from the Bloomberg U.S. 100 Index that develop, facilitate, or utilize artificial intelligence (AI) solutions, using Bloomberg Intelligence (BI) data.

Capital Markets Perspective: The full report

Download the PDF to understand how our asset allocation views may help inform client portfolio discussions.