Now leaving ThriventFunds.com


You're about to visit a site that is neither owned nor operated by Thrivent Asset Management.

In the interest of protecting your information, we recommend you review the privacy policies at your destination site.

Financial Professional Site Registration

Complete this form to get full access to the entire financial professional site.

By clicking “Register”, you agree to our privacy and security policies and that you are a financial professional.

Access will be granted immediately, but the registration process may take up to 5 business days to complete.

Thank you for registering

You can now enjoy all financial professional content.

If your download does not start automatically, click here.

An error occurred

Please check back later.

MARKET UPDATES

U.S. employment: Increasingly critical and complex

09/26/2025

WRITTEN BY:
Chief Investment Strategist
WRITTEN BY:
Steve Lowe, CFA,Chief Investment Strategist

Key points

Weakened employment

Recent job reports and the latest annual revisions in jobs created suggest employment has been weaker than expected and weaker for longer than the market assumed.

Difficulty estimating employment

Revisions to headline jobs data have been large, the labor force is evolving and one-off factors have distorted the data.

More detailed analysis is required

Investors need to look to a wider range of indicators to better understand the current employment situation and its longer-term impact on the economy and rates.


U.S. employment data from the Bureau of Labor Statistics (BLS) has been the subject of many headlines recently, in part because the jobs market may have weakened significantly, but also because the difficulty of measuring employment has itself become a topic of discussion.

The BLS’s monthly jobs report is among the most-watched economic data releases because it matters to the markets, the U.S. Federal Reserve (Fed) and the general public—as most people have a vested interest in employment. And while the recent BLS data paints an increasingly concerning picture of the state of the job market, it is becoming less clear whether the initial estimates released each month accurately reflect current employment conditions. Simply put, the revisions to the data have been significant, with the most recent annual revision showing that hiring had been overstated by 911,000 jobs (the largest preliminary revision on record1) over the 12 months ending in March of this year.

Accurate data is essential to the Fed’s ability to set the appropriate level of interest rates and critical to informed investing. As the jobs market weakens and the Fed increasingly turns its focus from inflation to employment to guide the path of interest rates, we have concerns about the current conditions data being accurate.

Estimating employment has become increasingly difficult

The BLS’s monthly “Employment Situation” report, released on the first Friday of every month, is revised twice over the subsequent two months and then held constant until the annual revision process, which delivers preliminary results each fall and then typically releases the final results in the first quarter of the following year.

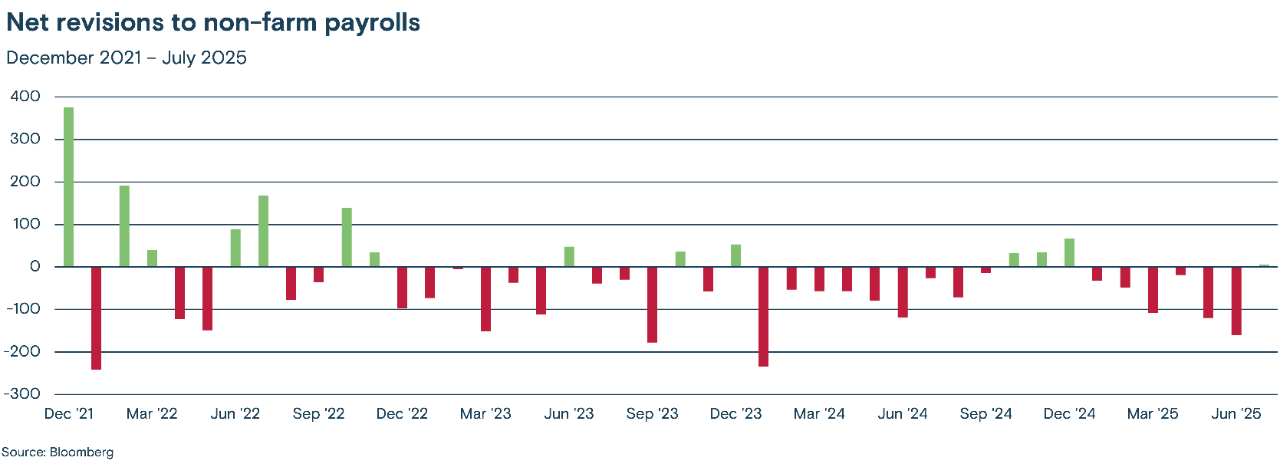
According to the BLS, the standard error for the first estimate (before revisions) of the number of jobs created each month is currently 82,5442. That means the BLS is reasonably confident the actual number of jobs created is somewhere between 82,544 more than the reported number or 82,544 less. Given the importance the markets place on the initial reported number, that is a dispiritingly wide range. The range has slowly widened and in the past few years the revisions have been mostly negative, as can be seen in the figure below.

Figure 1

This bar chart illustrates the net revisions to non-farm payrolls in the US from December 2021 to July 2025,  showing both positive and negative adjustments to previously reported employment figures over time.

Revisions can largely be explained by how long it takes businesses to respond to the BLS’s survey. In a recent report from the Richmond Federal Reserve3, citing BLS data, the percentage of firms replying in time for the initial (first) estimate has fallen from around 80% in 2015 to near 60% today. But those responding in time for the final estimate have stayed high, at almost 95%. Additionally, the report notes an increasing number of businesses are simply ignoring the survey. While the report speculates COVID-19 prompted many companies to withdraw from participating in the survey, the response rate has lingered near its lows for the past few years, further weighing on the accuracy of the recent data.

Changes in the labor force is creating additional complications

While demand for labor plays a key role in job creation or layoffs, the supply of labor also greatly impacts unemployment data. There has been a long-term secular decline in labor force participation over the last 25 years as the Baby Boomer generation has aged and retired, and as fewer women participate in the workforce for a variety of reasons, including the high cost of child care and a reduction in a remote work.

A decline in people seeking jobs can reduce the unemployment rate, as you need to be seeking employment to be counted as unemployed. A supply-constrained labor market can stoke inflation through higher wages, which in turn could push up inflation. That could prompt the Fed to have a more restrictive monetary policy.

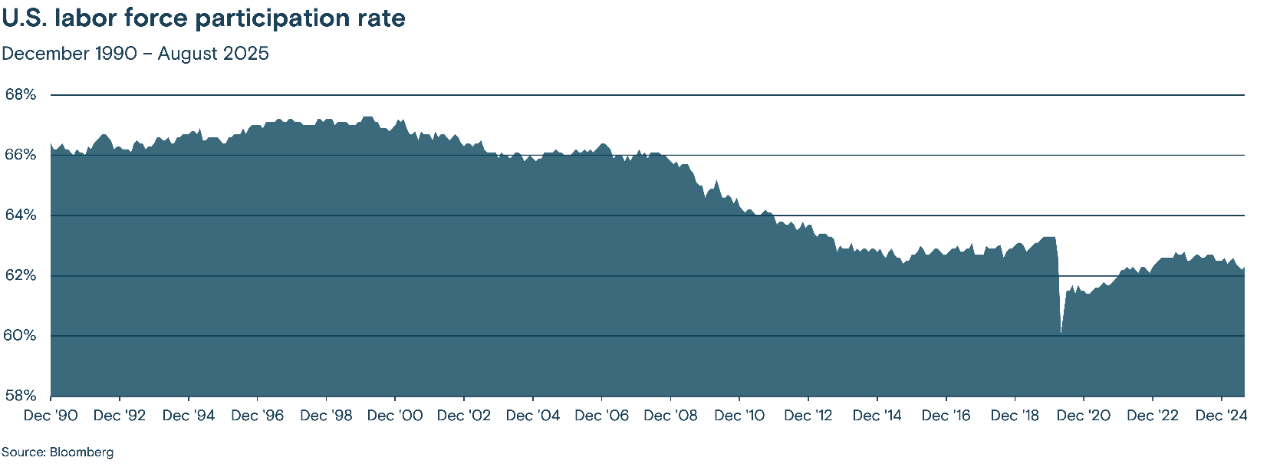
Immigration levels also greatly impact labor supply. Reduced immigration could further tighten labor market supply, lowering unemployment with fewer people looking for jobs, and pressuring wages higher as an enticement to bring more people back into the labor force. Participation in the labor force had been falling since the turn of the century and plummeted during the COVID-19 pandemic (Figure 2 below) putting relatively steady downward pressure on the unemployment rate over the past few decades. The recent dip in participation this year thus raises the question whether it is helping to mask greater weakness in the labor market than the currently low unemployment rate indicates. Finally, longer-term demographic trends such as declining birth rates and an aging population need to be taken into account when contextualizing unemployment.

Figure 2

This chart displays the U.S. labor force participation rate from December 1990 to August 2025, showing the percentage of the population that is either employed or actively seeking employment over time.

One-off events are also distorting the data

One-off events, like COVID-19 and the 2023 government shutdown, have created significant distortions in employment data by complicating the calculation of benchmarks used to make seasonal adjustments. The distortions created by COVID-19 also make trend analysis over time more complicated. Additionally, some economists have expressed concerns that layoffs at the BLS could complicate data collection. While these examples may have had more extreme effects than the typical one-off distortion to the data, unexpected events have and may be more likely to make the employment data murkier.

The impact of artificial intelligence (AI)

Some data indicates that AI has begun to impact the job market, particularly for younger individuals and in sectors that are likely to benefit from AI. For example, total software jobs held by those between the ages of 22-25 have fallen almost 20% in the past few years, while those held by employees older than 30 have either risen or held steady.4 A similar pattern appears for customer service representative jobs, where the number of positions held by 22–25 year-olds have fallen by more than 10% in the past few years, while the number of positions held by individuals over 30 has climbed or remained steady.

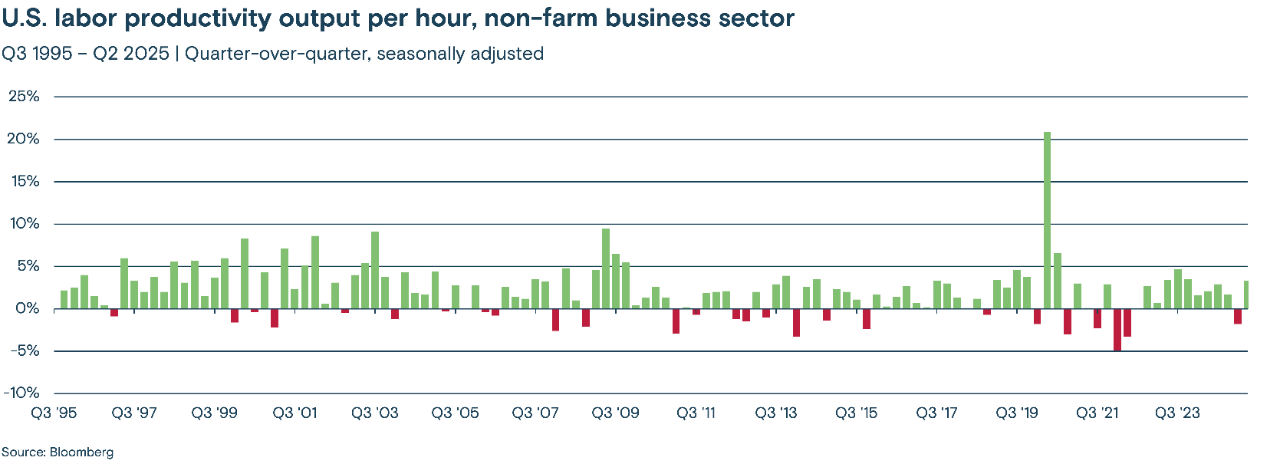
While it is too early to forecast AI’s effect on the broader economy, computers have long created something of a puzzle for policymakers and those trying to forecast employment. Fewer jobs are needed to accomplish the same goal because of technology (such as personal computers replacing typewriters or the advent of a searchable internet), which boosts profits through higher productivity, but that can be at the expense of employment. As Figure 3 below illustrates, productivity (measured as output per hour) has been rising for decades, primarily driven by technological innovations, with each surge necessitating a rebalancing of labor supply and demand. But history has shown that as new technologies displace jobs, other jobs also are created. Whether that pattern holds remains to be seen.

Figure 3

This bar chart illustrates the quarter-over-quarter, seasonally adjusted U.S. labor productivity output per hour in the non-farm business sector from Q3 1995 to Q2 2025,  showing both positive and negative percentage changes.

Our approach to measuring employment

Our approach to measuring and forecasting employment is grounded in our investment philosophy. We believe investors are best served by maintaining a long-term view on the broad trends affecting the key drivers of market returns, including employment. Specifically, our goal in evaluating the jobs market is to use a wide range of indicators and multiple lines of inquiry to ensure we have thoroughly and objectively reviewed the evidence. It certainly helps that we have a large team of researchers and experts in macroeconomic data who are encouraged to actively debate their perspectives, but at its core, our approach is based on the belief we can be more confident about our views on the longer-term trends in employment than predicting the next data release.

While the BLS report gets most of the market’s attention, there are many other sources of information about the current or recent status of the jobs market that can be used to help build confidence in the trends driving employment. The most well-known is the Automatic Data Processing (ADP) National Employment Report. ADP handles around 20% of all payroll services for the private sector and thus has a large sample size from which to report actual changes in employment. This monthly report is typically provided two days before the BLS report covering the same period.

Other private-sector measures include the Challenger Report, which tracks corporate layoff and hiring announcements and provides industry and geographic details, and employment website Indeed.com, which can report on changes in job openings listed on its website. The BLS also provides the regular JOLTS (job openings and labor turnover survey) report, and the National Federation of Independent Business (NFIB) provides a regular report on small business hiring. Additionally, various Fed branches publish regular data on employment, such as the Kansas City Fed’s labor momentum indicator and employment activity indicator. Finally, the Institute for Supply Management (ISM) provides a monthly manufacturing employment index, and its Services Purchasing Managers Index (PMI) provides insights into employment trends in the services sector.

While each of these data sources can provide helpful, if sometimes anecdotal, information about the state of employment, most of them have their limitations. None can claim to offer a better-than-average indication of the job market.

Simply put, accurately forecasting a specific employment number, or even precisely quantifying what happened in the past month, is quite difficult. The U.S. economy has over 340 million people in 50 states, each with its own economic drivers and labor regulations. Each assumption that must be made to aggregate the data brings additional potential for error or misestimation, and revisions (such as the annual BLS revisions) are inevitable. Despite the most ambitious and informed research, there will always be a margin of error.

Market perspectives delivered direct to your inbox

Subscribe to timely and relevant news, information, and trends on the topics that interest you most.

Employment has weakened

Recent BLS data has pointed to a significant decline in new jobs, and a broad and detailed analysis of the various data sources backs this up. Employment is weakening, and the latest annual revisions in jobs created suggest it has been weaker than expected, and weaker for longer than the market assumed. Finally, recent data has shown that the strength in the jobs market has been relatively narrow. Government and government-adjacent industries have accounted for a significant portion of the new jobs created, while employment in manufacturing and other goods-producing sectors has been weak. More recently, simply excluding health care (a relatively non-cyclical sector) and social assistance programs, net employment has been negative.

The broadest measure of unemployment, which includes unemployed people and people only working part-time, has risen steadily since the summer of 2023, and confidence in being able to find a job has been declining. A recent New York Fed survey asking those currently employed how confident they were about finding a new job in the next three months fell to its lowest reading since the survey began in 2013, and various data series suggest their pessimism may be justified. Job postings at Indeed.com are down, and the most recent Challenger Survey’s total of job hiring announcements was its lowest since 2009. Today, the sum of people employed plus the number of current job openings is fewer than the total labor force. That is, if layoffs continued at their normal pace, new jobs created would likely turn negative.

But not every indicator is weak or negative. The latest NIFB’s Small Business Hiring Plans Index shows that smaller businesses are increasing hiring, while business confidence broadly has shown signs of recovering after dipping during the height of the tariff policy uncertainty. And the JOLTS survey has shown companies may not be hiring, but are reluctant to fire, presumably anticipating a better economic environment in the quarters ahead.

In our analysis, the jobs market has softened as a result of relatively typical layoff rates combined with a reluctance to hire. Such an environment could persist in the months ahead and find support in lower interest rates, lower taxes, successful adaptation to new tariffs and a generally more favorable regulatory environment. But should the rate of layoffs start to rise, the risk of a spiraling jobs market will accelerate.

The data is in the details

Headlines rarely tell the whole story, and economic data releases are no different. When it comes to employment data, the need for thorough analysis and rigorous debate is even higher, given larger revisions, changes in the labor force, one-off factors that distort the data and the impact of AI.

Furthermore, we expect markets will continue to see initial job estimates from the BLS as being more reliable than they are. For example, estimates for changes in future interest rates have been particularly volatile around jobs reports that significantly exceeded or underperformed expectations, even if the reported number was within the BLS’s estimate of its margin of error. 

As we navigate the current economic environment, we encourage investors to be mindful that data releases generally are more volatile during turning points, especially when transitioning from a relatively stable jobs market to a weaker one. And we encourage investors to keep in mind that all economic data, including gross domestic product (GDP), is subject to revision. A healthy skepticism should be applied to all headlines reporting initial estimates, and confidence should be placed in trends visible only after collating all of the available data and considering the context.


Media contact: Callie Briese, 612-844-7340; callie.briese@thrivent.com

All information and representations herein are as of 09/26/2025, unless otherwise noted.

The views expressed are as of the date given, may change as market or other conditions change, and may differ from views expressed by other Thrivent Asset Management, LLC associates. Actual investment decisions made by Thrivent Asset Management, LLC will not necessarily reflect the views expressed. This information should not be considered investment advice or a recommendation of any particular security, strategy or product. Investment decisions should always be made based on an investor's specific financial needs, objectives, goals, time horizon, and risk tolerance.

The labor force participation rate is an estimate of an economy’s active workforce. The U.S. government’s labor force participation rate formula is the number of people ages 16 and older who are employed or actively seeking employment, divided by the total non-institutionalized, civilian working-age population.

NPR, “BLS revision shows annual hiring was overstated by 911,000 jobs,” Sept. 9, 2025, (Sept. 18, 2025).

U.S. Bureau of Labor Statistics, “Current Employment Statistics - CES (National): Table 4. Standard and relative standard errors of CES sample-based estimates for a 1-month change,” (Sep. 18, 2025).

John O’Trakoun, Federal Reserve Bank of Richmond, “Answers don’t come easy,” Aug. 25, 2025, (Sept. 18, 2025). 

Erik Brynjolfsson, Bharat Chandar, Ruyu Chen, “Canaries in the Coal Mine? Six Facts About the Recent Employment Effects of Artificial Intelligence,” August 26, 2025, (Sept. 18, 2025).