Now leaving ThriventFunds.com


You're about to visit a site that is neither owned nor operated by Thrivent Asset Management.

In the interest of protecting your information, we recommend you review the privacy policies at your destination site.

Financial Professional Site Registration

Complete this form to get full access to the entire financial professional site.

By clicking “Register”, you agree to our privacy and security policies and that you are a financial professional.

Access will be granted immediately, but the registration process may take up to 5 business days to complete.

Thank you for registering

You can now enjoy all financial professional content.

If your download does not start automatically, click here.

An error occurred

Please check back later.

DECEMBER 2024 MARKET UPDATE

Stocks keep rolling

12/10/2024


Key points

Economic impact

Interest rates are unlikely to rise much further or fall quickly.

Market

Investors may want to consider rotating from cash to Treasuries and/or corporate bonds.


WRITTEN BY:
Chief Investment Strategist
WRITTEN BY:
Steve Lowe, CFA,Chief Investment Strategist

Thrivent Asset Management contributors to this report: John Groton, Jr., CFA, director of administration and materials & energy research; Matthew Finn, CFA, head of equity mutual funds; and Yale Nelson, CFA, CFP, investment product manager


Key points

Equities stay high

The S&P 500 Index ended November at another all-time high.

Inflation stalling

November inflation data met market expectations, but still hasn’t achieved the U.S. Federal Reserve’s target.

Employment rebounds

November saw a higher number of jobs created than expected, showing recovery from hurricanes and a worker strike.


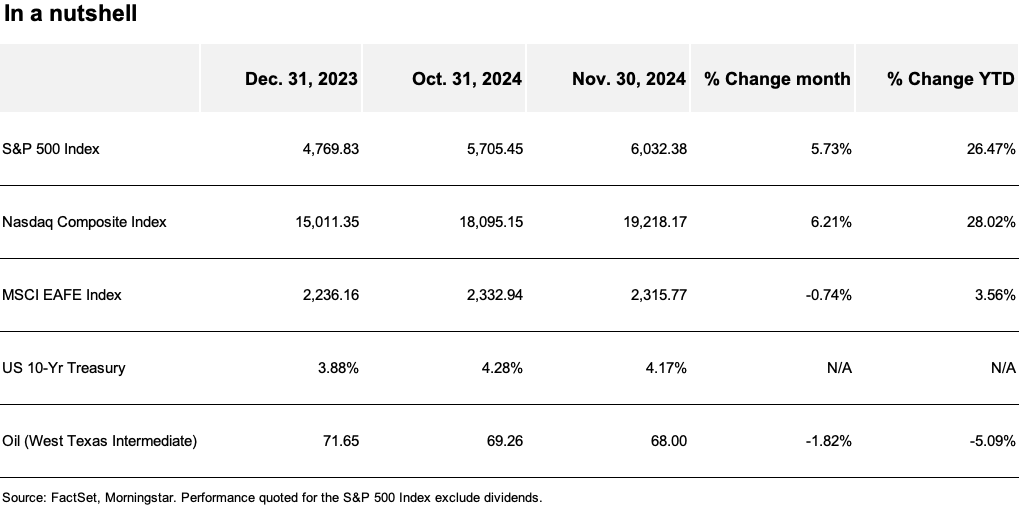
Chart summarizing the performance of select market indexes, 10-year T bonds, and oil.


The markets broadly judged the results of the U.S. presidential and congressional elections as positive for economic growth, but also potentially inflationary. The S&P 500® Index surged after the election and, despite a mid-month correction, ended the month at yet another all-time high. While it took longer to determine that the Republican Party would retain control of the House of Representatives (albeit by a small margin), and thus both houses of Congress, consensus grew that the incoming administration was likely to extend the existing tax cuts, possibly lower taxes and generally implement a more business-friendly approach to regulation.

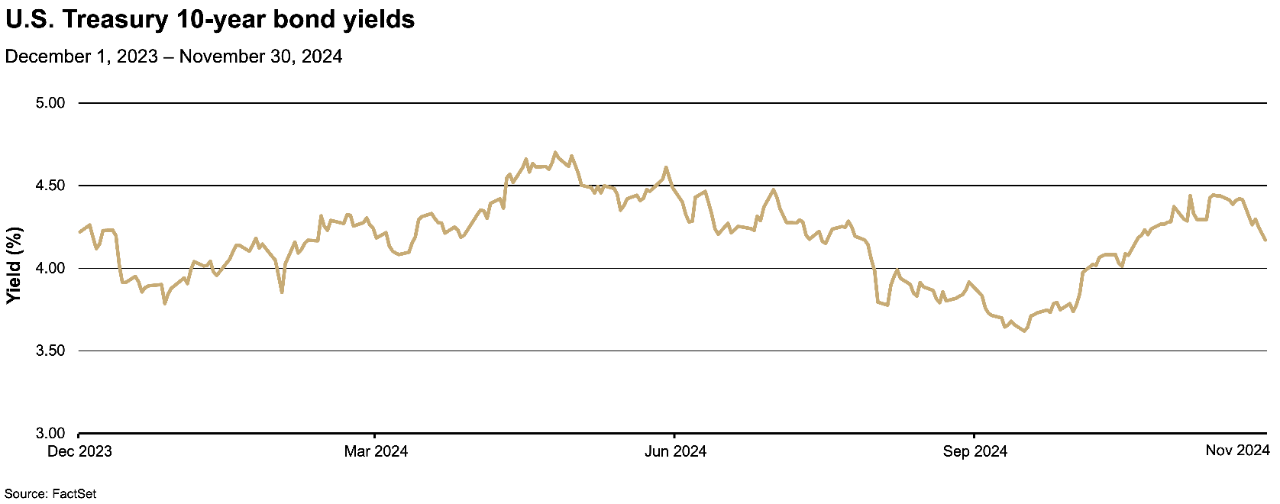
The reaction in the bond markets was more mixed. Longer-dated Treasury yields had been rising since September, partly due to uncertainty around the election. 10-year Treasury yields rose further in the days after election but peaked near 4.45%. The nomination of Scott Bessent—a known deficit hawk—for Treasury Secretary kicked off a rally, and a combination of high absolute yields attracting buyers, inflation data meeting forecasts and expectations for interest rate cuts all worked to sustain the rally into month end.

The economic data released over the month was mixed, but broadly supportive for sustained economic growth. With the exception of the strike and hurricane distorted October figures, monthly job creation has rebounded from the summer lows. Retail sales were again robust, third-quarter gross domestic product (GDP) was revised higher to 2.8% (above expectations), the Purchasing Managers’ Index (PMI) rose more than expected and the Institute for Supply Management (ISM) survey showed continued expansion.

Meanwhile, inflation data reported over the month, while meeting market expectations, indicated the trend toward the U.S. Federal Reserve’s (Fed’s) target rate may be stalling, with both the Consumer Price Index (CPI) and the Personal Consumption Expenditures (PCE) Price Index rising modestly year over year. While the incoming administration campaigned on a number of potentially inflationary policies (notably more tariffs and less immigration) equity markets by and large adopted a wait-and-see approach.

However, expectations for interest rate cuts were significantly scaled back over the month. While the Fed did cut its target rate by 0.25% at its November meeting, by November end expectations for future cuts had been significantly reduced to between three and four more cuts through the end of 2025.

Outlook: We expect economic growth will remain robust and the incoming administration will enact pro-growth policies. However, there remains a high level of uncertainty around which—and how much—of the advertised policies will become law.

The largest risk to our base case view that the U.S. economy will achieve a soft landing is expansionary fiscal policies or sticky inflation forcing the Fed to slow the pace of rate cuts even more than the market currently expects. While the consumer sector has demonstrated its resiliency, there are signs of weakness, and persistent inflation or sustained higher interest rates could eventually take a larger toll on consumer confidence.

We maintain a modest overweight to equities versus fixed income going into year end. In our view, equity markets need sustained economic growth to both extend the recent strength in the more cyclical sectors and to see broader gains in value stocks as well as the mid- and small-capitalization segments of the market. While we remain optimistic, volatile economic data comes hand-in-hand with turning points in the economy. Furthermore, we believe it is too soon to make aggressive assumptions about the incoming administration’s economic policies and the effects on the economy, inflation and interest rates.

However, we believe the market’s current expectations for the Fed’s interest rate cuts over the coming year are reasonable, if a bit conservative. As such, we expect Treasury yields will likely remain in a range around current levels, though may be volatile within that range. We believe such an outcome justifies a more neutral strategic stance, focused in shorter-term maturities, and careful monitoring of both economic data and the incoming administration’s policy choices.

Drilling down

U.S. stocks rise

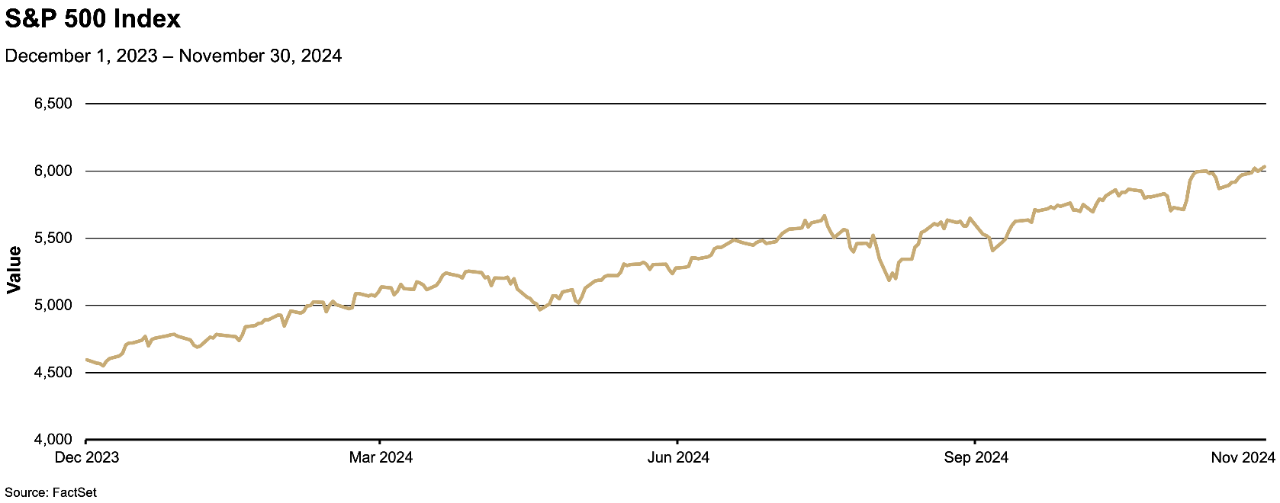
The S&P 500 Index rose 5.73% in November, from 5,705.45 at the October close to 6,032.38 at the end of November. The total return of the S&P 500 Index (including dividends) for the month was 5.87%, bringing its year-to-date return to 28.07%.

The NASDAQ Composite Index® also rose in November, up 6.21% from 18,095.15 at the end of October to 19,218.17 at the November close. Year to date, the index has risen 28.02%.

Chart depicting the value of the S&P 500 Index from December 2023 to November 2024


Retail sales rise

October retail sales rose 0.4% from September and 2.8% from October 2023, according to the November 15 report from the U.S. Census Bureau. The monthly rise was lower than in the previous month, but September’s data was revised higher, and October’s sales were larger than consensus expectations, helping to bolster expectations that consumer strength remains robust.

Relative to August sales, the rise was led by electronics and appliance store sales, up 2.3% over the month, followed by motor vehicles and parts dealers, which was up 1.6%. Relative to September 2023, the rise was led by food services and drinking places, up 7.0%, followed by non-store retailors (primarily online sales), which rose 4.3% and miscellaneous store retailers, which were up 4.0%.

Jobs data rebounds

November’s employment report, released in early December, showed 227,000 new jobs were created during the month. This was above consensus expectations for 214,000 new jobs. Additionally, the 223,000 jobs added in September was revised up to 255,000 and the 12,000 jobs added in October was revised up to 36,000. (The outlier October numbers are believed to be significantly skewed by a strike at Boeing, America’s largest aerospace manufacturer, and multiple hurricanes in the southeast.)

The national unemployment rate rose by a modest 0.1% to 4.2% over the month, while average hourly earnings rose by 0.4% (0.1% above expectations), a 4.0% increase from November of last year.

RELATED CONTENT

RELATED ARTICLE

2025 Market Outlook: Stay invested but expect volatility

There are good reasons to believe robust economic growth will continue into 2025.

RELATED PODCAST

Taking the vitals of the U.S. consumer

In this special deep dive on consumer health, Thrivent experts provide a diagnosis.


Sector strength was broad based

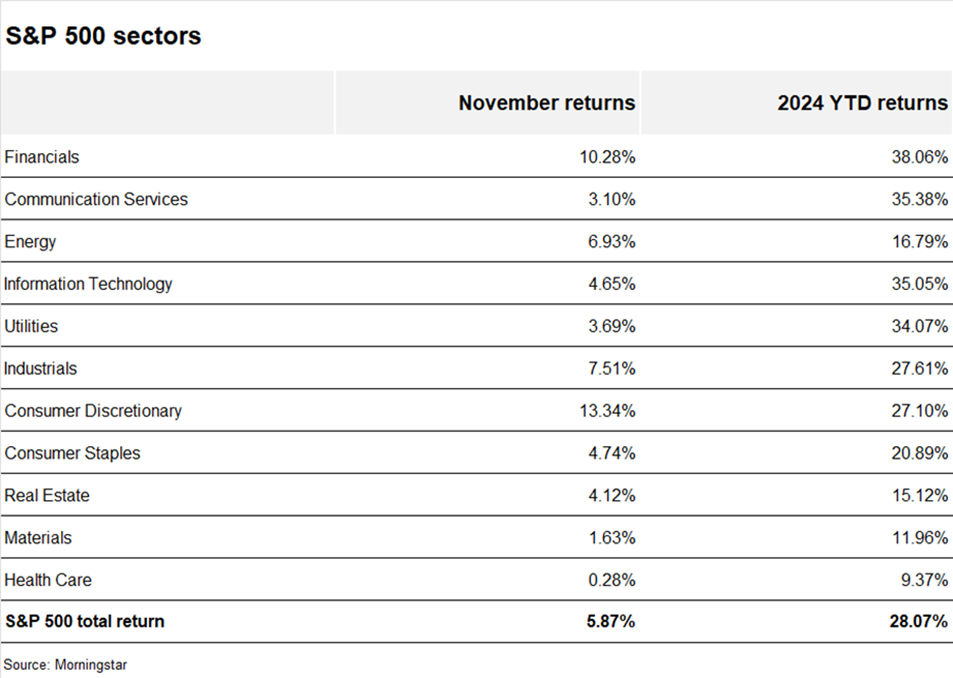
All 11 sectors in the S&P 500 Index rose in November, led by the consumer discretionary (+13.34%) and financials (+10.28%) sectors, on expectations for sustained growth, lower taxes and a more expansionary fiscal policy. Expectations for de-regulation were particularly supportive for the financials and energy (+6.93%) sectors.

The chart below shows the past month and year-to-date performance results of the 11 sectors:

Chart depicting the November 2024 and year-to-date returns of 11 S&P 500 sectors.


Treasury yields fall

The yield on the benchmark 10-year U.S. Treasury note rose after the November election, peaking at 4.45% mid-month, before falling back to close the month at 4.17%, a decline of 0.11% from the October 31 close at 4.28%.

The Bloomberg U.S. Aggregate Bond Index rose 1.06% in November, bringing its year-to-date return to 2.93%.

Chart depicting U.S. Treasury 10-year bond yields from December 2023 to November 2024


Oil prices decline

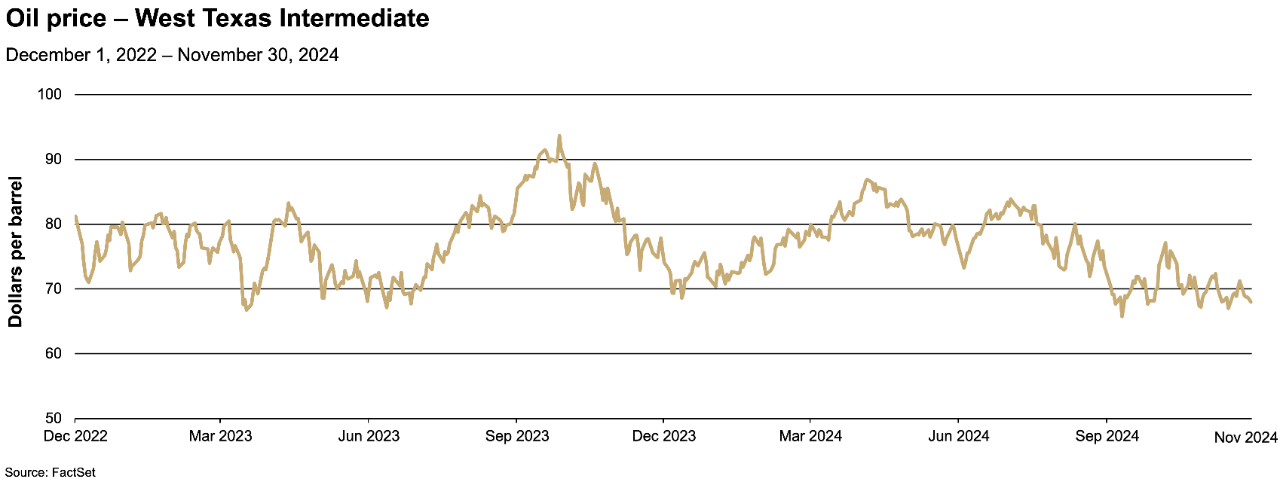
Oil prices ended the month slightly lower on sustained concerns about weakening demand from China and concern OPEC+ (a consortium of oil producing nations including Saudi Arabia and Russia) may allow some of its standing production cuts to expire. A barrel of West Texas Intermediate, a grade of crude oil used as a benchmark in oil pricing, fell 3.35% over the month, from $69.26 at the end of October to $68.00 at the November close. Gasoline prices at the pump also fell, down 3.12%, with the average price per gallon falling from $3.27 at the end of October to $3.17 at the end of November.

Chart depicting the price per barrel of West Texas Intermediate crude oil from December 2022 to November 2024.


International equities decline

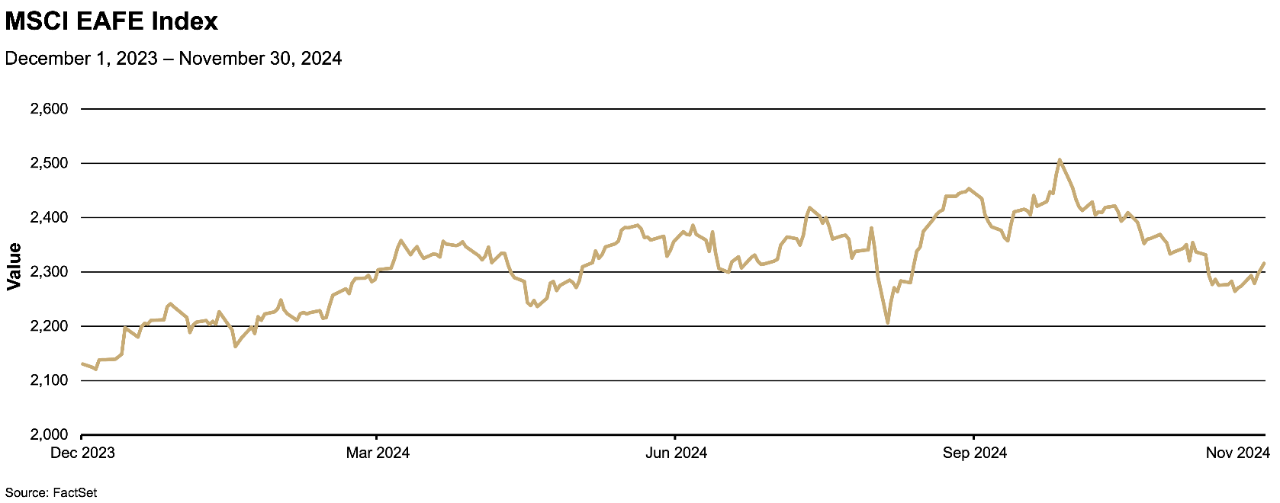
The MSCI EAFE Index, which tracks developed-economy stocks in Europe, Australasia and the Far East, fell 0.74% over the month, from 2,332.94 at the end of October to 2,315.77 at the November close. The index’s year-to-date gains dropped to 3.56%. Worries about slower economic growth in China leading to lower consumption, and growing concerns about the health of the automotive industry in Europe, weighed on markets in November.

Chart depicting the value of the MSCI EAFE Index from December 2023 to November 2024

Media contact: Callie Briese, 612-844-7340; callie.briese@thrivent.com

All information and representations herein are as of 12/06/2024, unless otherwise noted.

The views expressed are as of the date given, may change as market or other conditions change, and may differ from views expressed by other Thrivent Asset Management, LLC associates. Actual investment decisions made by Thrivent Asset Management, LLC will not necessarily reflect the views expressed. This information should not be considered investment advice or a recommendation of any particular security, strategy or product. Investment decisions should always be made based on an investor's specific financial needs, objectives, goals, time horizon, and risk tolerance.

The S&P 500® Index is a market-cap weighted index that represents the average performance of a group of 500 large-capitalization stocks.

NASDAQ – National Association of Securities Dealers Automated Quotations – is an electronic stock exchange with more than 3,300 company listings.

The Bloomberg U.S. Aggregate Bond Index is an unmanaged index considered representative of the U.S. investment-grade, fixed-rate bond market.

The Consumer Price Index measures the monthly change in prices paid by U.S. consumers for a basket of goods and services.

The Personal Consumption Expenditures (PCE) Price Index, also known as consumer spending, is a measure of the spending on goods and services by people of the U.S.

The MSCI EAFE Index is an unmanaged index designed to represent the performance of large and mid-cap securities across 21 developed markets, including countries in Europe, Australasia and the Far East, excluding the U.S. and Canada.

The Purchasing Managers’ Index (PMI) is an indicator of the direction of economic trends in the manufacturing and services sectors.

The Institute for Supply Management (ISM) survey is a monthly indicator of U.S. economic activity based on a survey of purchasing managers at manufacturing firms nationwide.

Any indexes shown are unmanaged and do not reflect the typical costs of investing. Investors cannot invest directly in an index.

This article refers to specific securities which Thrivent Mutual Funds may own. A complete listing of the holdings for each of the Thrivent Mutual Funds is available on thriventfunds.com.

Past performance is not necessarily indicative of future results.