Uncertainty strikes back
Market volatility and uncertainty are expected to continue, raising the odds for a recession.
04/07/2025
1st QUARTER 2025 MARKET REVIEW
04/11/2025
Investors may want to consider rotating from cash to Treasuries and/or corporate bonds.
Thrivent Asset Management contributors to this report: John Groton, Jr., CFA, director of administration and materials & energy research; Matthew Finn, CFA, head of equity mutual funds; Kent White, CFA, head of fixed income mutual funds; and Yale Nelson, CFA, senior product specialist
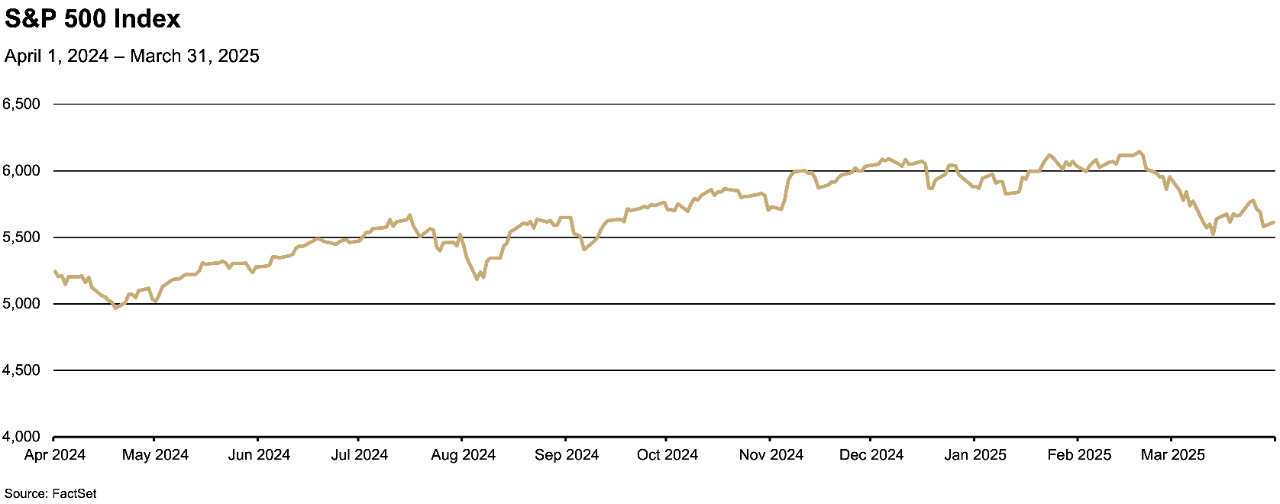
Stock record highs were again set in February before uncertainty dropped returns in the negative for the quarter.
Both consumer and business confidence declined throughout the quarter.
The economy: The U.S. economy entered 2025 with strong domestic demand, a robust jobs market and rising productivity amid a massive investment boom in artificial intelligence. Businesses came into the year optimistic that they would be able to benefit from a new administration delivering lower taxes, less regulation and a generally more business-friendly environment. But uncertainty over trade and economic policy increasingly led both companies and consumers to become less confident in their economic outlook. Uncertainty about tariffs, government spending and the impact of immigration policies on the labor market all contributed to the market’s concerns, but the effect of tariffs on economic growth and inflation had the greatest impact.
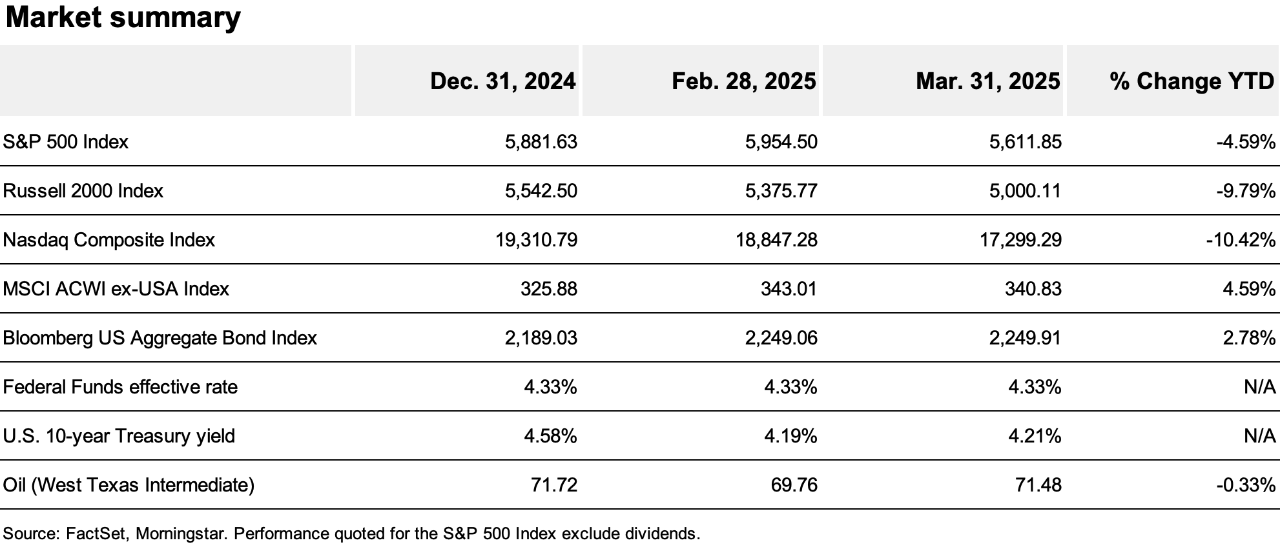
Stocks: The benchmark S&P 500® Index set another new high in February, before headlines weighed on market sentiment, pushing the index to a -4.59% return over the quarter. On April 2, just after quarter end, the tariffs announced by the Trump administration more than doubled the S&P 500’s quarterly loss and pushed the Russell 2000 Index® and NASDAQ Composite Index® into technical bear markets (falling more than 20% from a recent peak) as expectations for earnings growth in the coming quarters were slashed.
Bonds: Treasuries had the best start to a year since 2020 as yields fell, boosting bond prices. When the year began, longer-dated yields were near multi-year highs, making them attractive on an absolute basis. But despite sticky inflation data and fears of higher inflation driven by tariffs, rising uncertainty and a weaker economic outlook encouraged investors to favor the relative safety of longer-term government bonds. Investment-grade corporate bonds saw some widening in their yield spreads (the yield paid over a comparable length U.S. Treasury bond) but were supported by falling Treasury yields. The Bloomberg U.S. Aggregate Bond Index rose 2.78% over the quarter.
For more on the economy and our outlook for the markets, see: Thrivent 2nd Quarter Market Outlook: Uncertainty strikes back, by Chief Investment Strategist Steve Lowe
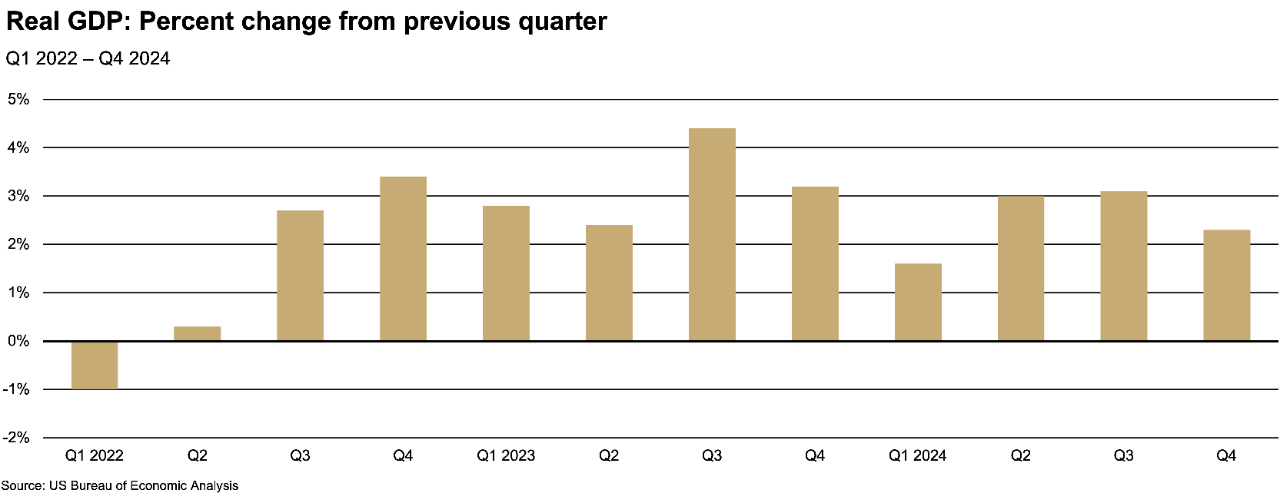
The U.S. economy had been growing at a solid pace, with a 2.4% growth rate in the fourth quarter of 2024. But a wide range of U.S. economic data released in February showed weakness below consensus expectations, prompting some Wall Street firms to cut their first-quarter growth forecasts. In March, the ISM Manufacturing Index fell to 49—below the 50-threshold which indicates a contraction in activity—while its measure of prices paid rose to its highest level since June of 2022.
Retail sales were lower over the period, with January seeing the largest monthly decline in almost two years (down 0.9%), while February saw a lower-than-expected rise of just 0.5% relative to January’s already weak results.
Consumer debt delinquencies rose over the period but remained relatively low compared to history. While the lower- to middle-income segments are more stretched, the overall consumer’s balance sheet is relatively strong with low debt to disposable income.
However, consumer confidence has declined rapidly. In March, the University of Michigan’s Consumer Sentiment Index fell to its lowest level in four years, driven by concerns about the economy and higher prices. The Index’s measure of confidence over the short term (the next six months) plummeted even further to 12-year lows.
February’s employment report showed just 151,000 new jobs were created during the month, but that was later revised down to 117,000. March’s gains, however, exceeded consensus expectations with 228,000 new jobs added—well above the 158,000 average monthly gain over the past year and despite rising government layoffs. The unemployment rate rose slightly from 4.1% to 4.2%, but this was largely due to rounding as the rate rose from 4.14% in February to just 4.15% in March. Average hourly earnings in March again rose by 0.3% (in line with expectations), a 3.8% increase from March of last year.
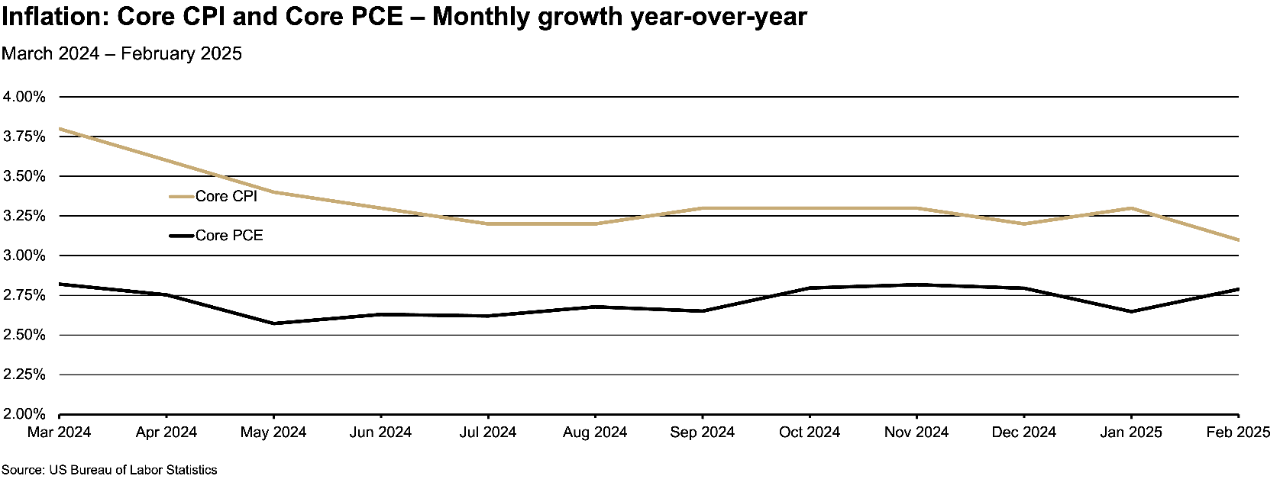
January’s month-on-month Consumer Price Index (CPI) data showed the largest rise since August 2023, at 0.5%, while Core CPI (which excludes the more volatile food and energy sectors) rose 0.4%, above consensus expectations and the largest month-on-month increase in core prices since April of 2023. However, the rate of growth slowed in February, with both headline and core inflation rising just 0.2%.
Core Personal Consumption Expenditures (PCE) Price Index data, which is the U.S. Federal Reserve’s (Fed) preferred inflation measure, remained above the Fed’s target range, rising 2.6% in January and 2.8% in February from a year prior.
RELATED ARTICLE
Market uncertainty: Tariffs and economic policy drive volatility
It can be difficult for markets to assess the impact of tariffs because they can be added or removed quickly, and there isn’t always insight into what’s coming next.
RELATED VIDEO
Q2 2025 Capital Markets Perspective
We discuss how Q1 market volatility is influencing our investing positions for Q2.
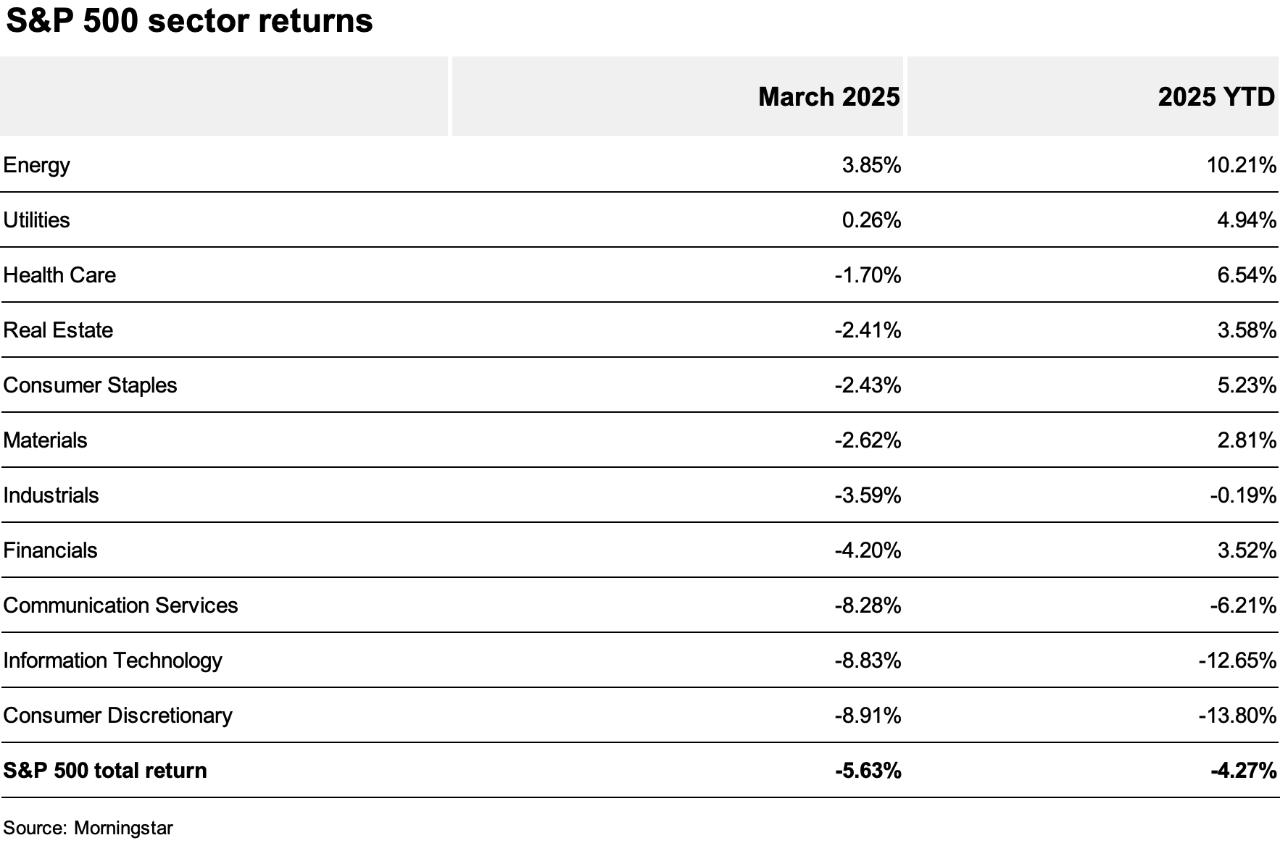
The benchmark S&P 500 Index set a new high early in the quarter when optimism still prevailed. But as uncertainty about escalating trade tensions grew, the market first stagnated, then declined. After falling 5.63% in March, the S&P 500 Index ended the quarter down 4.57%. The benchmark Russell 2000 Index of small-cap stocks fell 9.79% over the period, and the technology-heavy NASDAQ Composite Index lost 10.42%. By early April, the S&P 500 Index would extend its year-to-date losses to nearly 15%, while both the Russell 2000 Index and the NASDAQ Composite Index entered technical bear markets.
The table below shows the past month and year-to-date performance results of the 11 sectors:
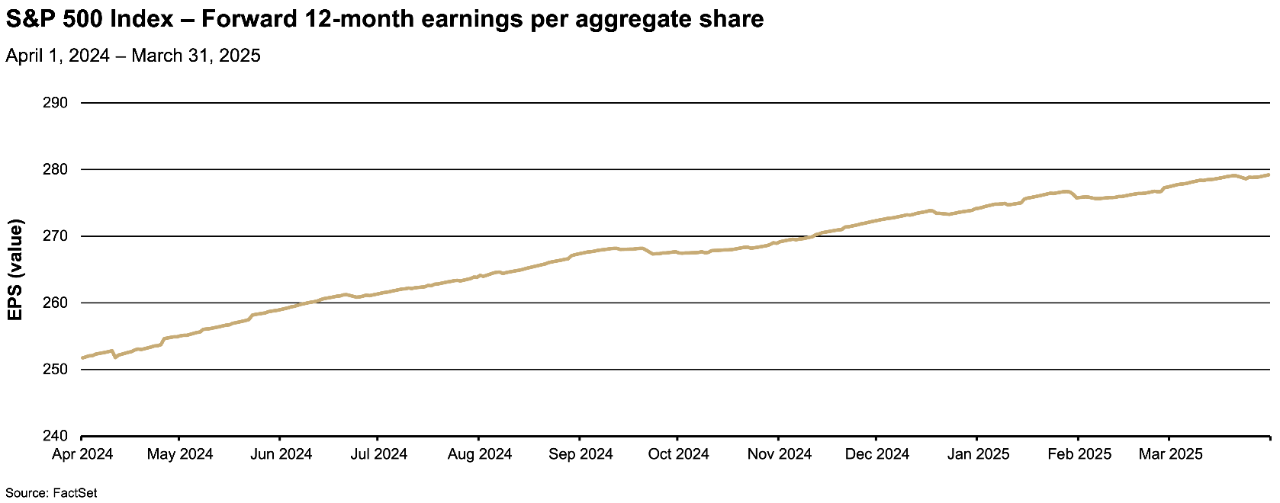
Corporate 12-month earnings projections for the S&P 500 Index steadily rose from the start of the year. However, while earnings per share (EPS) estimates rose 1.88% over the quarter, concerns over earnings did grow near quarter end as expectations for significant tariff-induced weakness gathered steam.
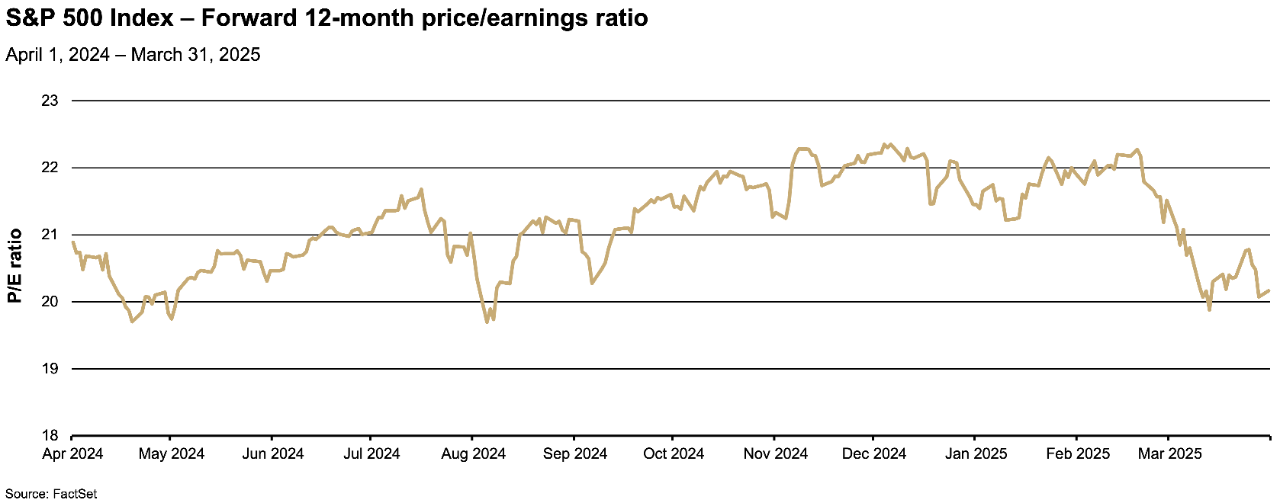
The forward 12-month price-earnings ratio (P/E) of the S&P 500 Index fell 5.93% over the first quarter, from 21.46 at the end of December 2024 to 20.16 at the end of March. A lower P/E ratio means stocks are less expensive relative to their EPS.
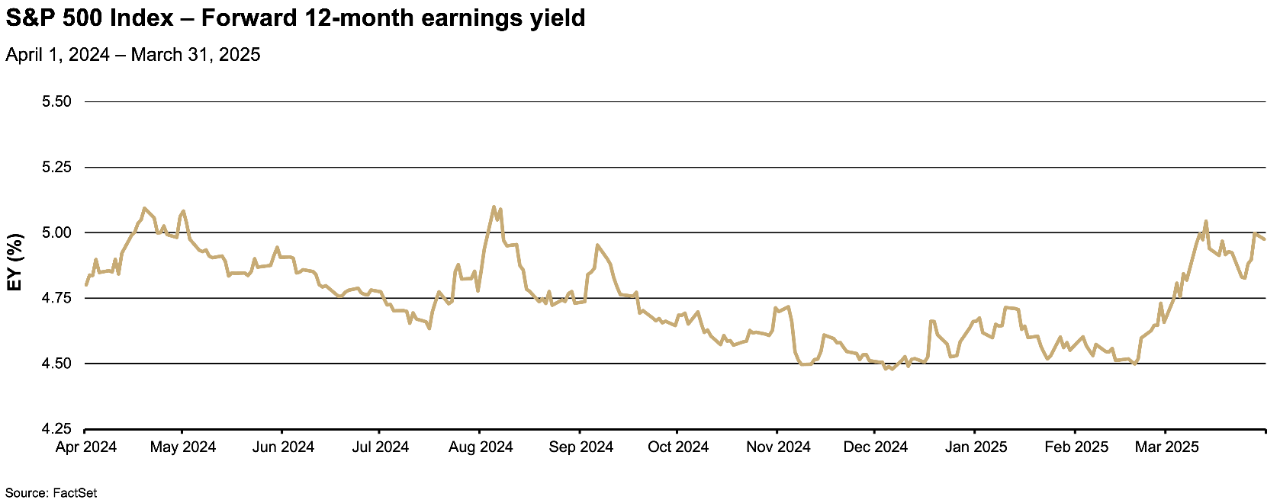
The forward 12-month earnings yield, which is the inverse of P/E, rose over the quarter as equity prices fell. At 4.98%, the forward 12-month earnings yield ended the quarter well above the 4.21% yield offered by 10-year U.S. Treasuries. The 12-month forward earnings yield can be helpful in comparing equity earnings yields with current bond yields.
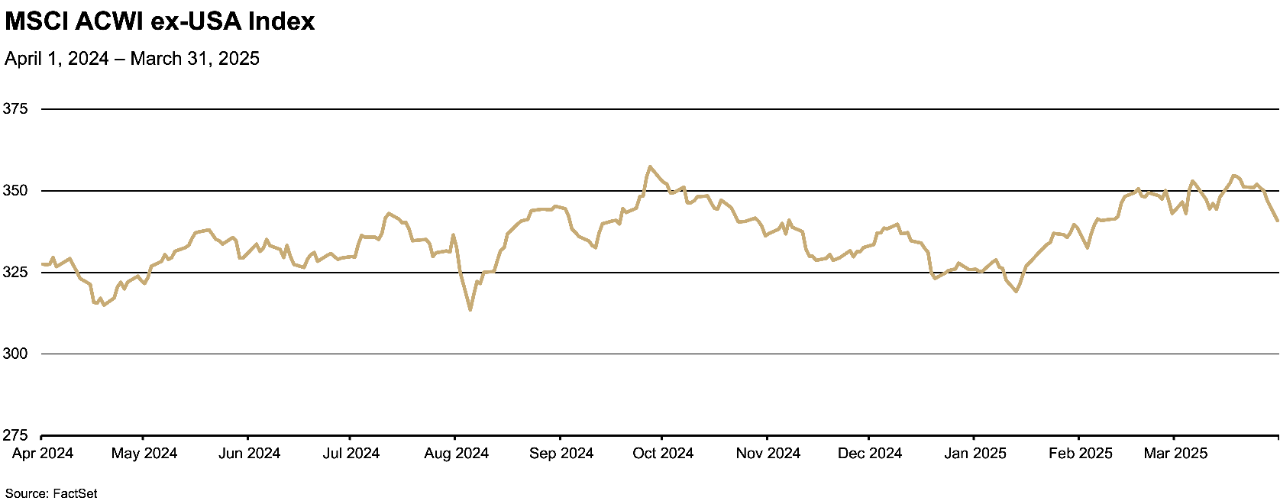
The MSCI ACWI ex-USA Index®, which tracks stocks from developed and emerging-market economies across the world (excluding the U.S.) rose 4.59% over the quarter, significantly outperforming broad-based U.S. equity indices. Gains were driven by European equities, which were supported by continued interest-rate cuts from the European Central Bank, loosening of European Union fiscal limitations and increased government spending. Asian equites were also strong over the period, supported by solid performance in Chinese stocks, though Japanese equities were relatively weak, largely as a result of continued yen strength.
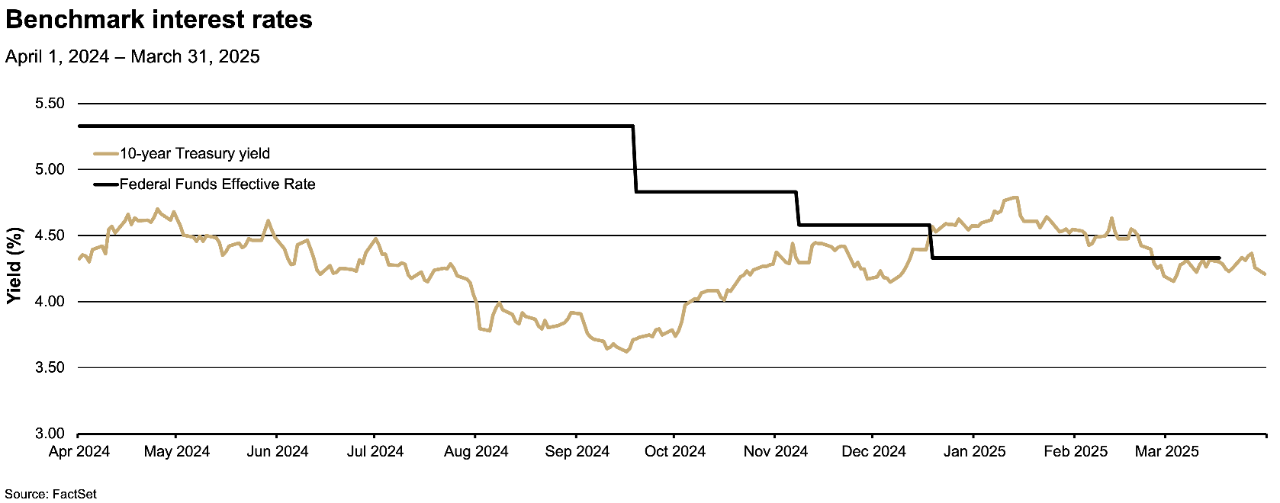
Benchmark 10-year Treasury bond yields fell from 4.58% (near multi-year highs) at the end of last year to 4.21% at the end of March, largely due to rising policy uncertainty and weaker economic growth expectations.
The Fed chose to make no changes to policy rates over the period. While expectations for future rate cuts grew as the economic outlook worsened, few were surprised to see Fed Chair Jerome Powell indicate a willingness to be cautious until there was greater clarity on trade policy.
Corporate bond spreads widened over the period, weighing on total returns, but were supported by falling Treasury yields. Investment-grade corporate bonds, helped by relatively strong company fundamentals, generally widened less than the lower-rated high-yield market, and from historically tight levels. The Bloomberg U.S. Aggregate Bond Index rose 2.78% over the quarter.
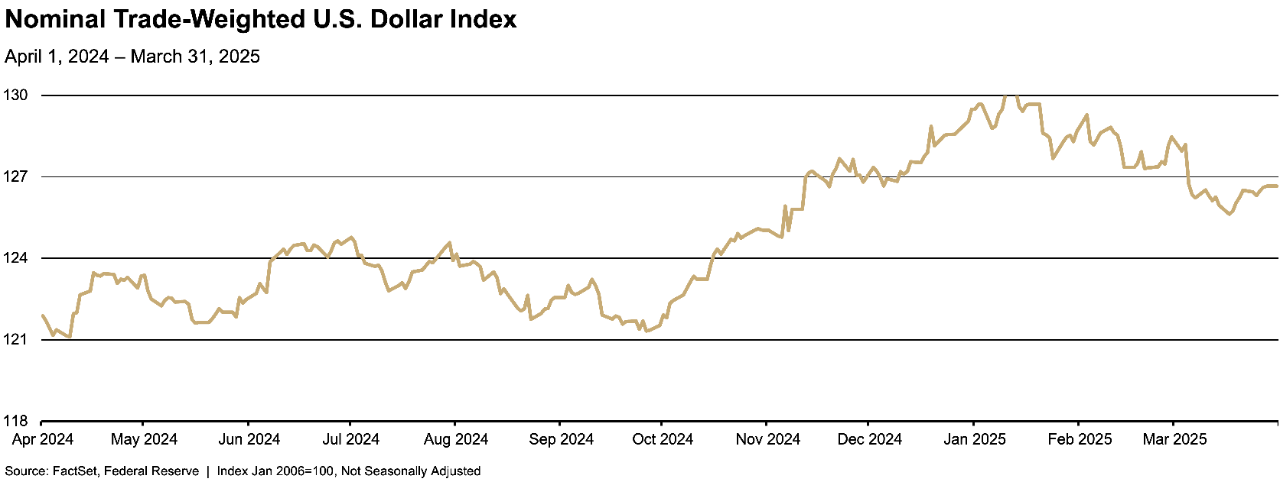
The Nominal Trade-Weighted U.S. Dollar Index fell 2.18% over the quarter. The decline was predominately driven by uncertainty over trade policy and the U.S. economic outlook, but strength in the euro and Japanese yen also contributed to the U.S. dollar’s relative weakness. The euro was supported by expectations for higher government spending in the region while the yen continued to strengthen on expectations for rising interest rates in Japan.
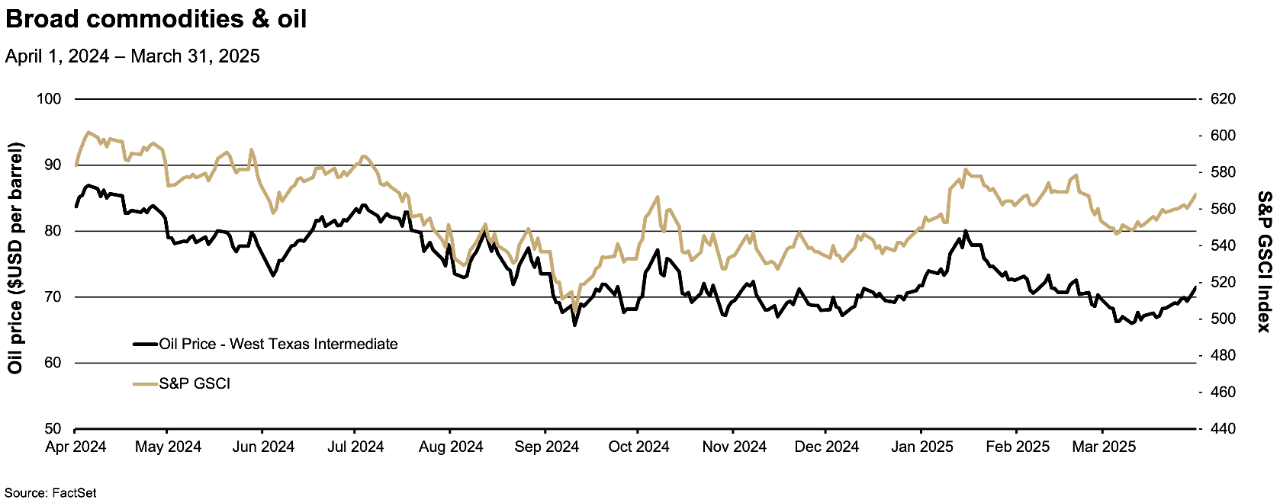
The S&P GSCI Index (a broad-based and production-weighted index representing the global commodity market) rose 2.63% in the first quarter. The price of gold continued its rise, up nearly 20% over the period, fueled by global central bank demand and concerns about a weaker U.S. dollar and higher inflation. Oil prices were down sharply, with a barrel of West Texas Intermediate (a grade of crude oil used as a benchmark in oil pricing) falling 5.21% over the period.
All information and representations herein are as of 04/11/2025, unless otherwise noted.
The views expressed are as of the date given, may change as market or other conditions change, and may differ from views expressed by other Thrivent Asset Management, LLC associates. Actual investment decisions made by Thrivent Asset Management, LLC will not necessarily reflect the views expressed. This information should not be considered investment advice or a recommendation of any particular security, strategy or product. Investment decisions should always be made based on an investor's specific financial needs, objectives, goals, time horizon, and risk tolerance.
The forward PE ratio uses the forecasted earnings per share of the company over the next 12 months for calculating the price-earnings ratio. It is calculated by dividing the price per share by forecasted earnings per share over the next 12 months.
Earnings yield is the 12-month earnings divided by the share price. Earnings yield is the inverse of the P/E ratio. Earnings yield is one indication of value; a low ratio may indicate an overvalued stock, or a high value may indicate an undervalued stock.
The S&P 500® Index is a market-cap weighted index that represents the average performance of a group of 500 large-capitalization stocks.
The Russell 2000® Index is an unmanaged index considered representative of small-cap stocks.
The Nasdaq Composite Index is a stock market index that includes almost all stocks listed on the Nasdaq stock exchange. The Nasdaq – National Association of Securities Dealers Automated Quotations – is an electronic stock exchange with more than 3,300 company listings.
The MSCI ACWI ex-USA Index is an unmanaged index considered representative of large- and mid-cap stocks across developed and emerging markets, excluding the U.S.
The Bloomberg U.S. Aggregate Bond Index is an unmanaged index considered representative of the U.S. investment-grade, fixed-rate bond market.
The Federal Funds effective rate is the interest rate at which depository institutions (mainly banks) lend reserve balances to other depository institutions overnight on an uncollateralized basis. In simpler terms, it's the rate banks charge each other for short-term loans to meet their reserve requirements.
The Consumer Confidence Index (CCI) is a survey administered by the Conference Board. The CCI measures what consumers are feeling about their expected financial situation, whether that's optimistic or pessimistic.
The University of Michigan Consumer Sentiment Index is a consumer confidence index published monthly by the University of Michigan.
The Consumer Price Index measures the monthly change in prices paid by U.S. consumers for a basket of goods and services.
The Core Consumer Price Index (CPI) measures changes in the prices of goods and services, with the exclusion of food and energy.
The Personal Consumption Expenditures (PCE) Price Index, also known as consumer spending, is a measure of the spending on goods and services by people of the U.S.
The Core Personal Consumption Expenditures (PCE) Price Index, also known as consumer spending, is a measure of the spending on goods and services, excluding food and energy prices, by people of the U.S.
The Nominal Trade-weighted U.S. Dollar Index measures the value of the U.S. dollar based on its competitiveness versus trading partners.
The Institute for Supply Management (ISM) survey is a monthly indicator of U.S. economic activity based on a survey of purchasing managers at manufacturing firms nationwide.
Any indexes shown are unmanaged and do not reflect the typical costs of investing. Investors cannot invest directly in an index.
Past performance is not necessarily indicative of future results.