Now leaving ThriventFunds.com


You're about to visit a site that is neither owned nor operated by Thrivent Asset Management.

In the interest of protecting your information, we recommend you review the privacy policies at your destination site.

Financial Professional Site Registration

Complete this form to get full access to the entire financial professional site.

By clicking “Register”, you agree to our privacy and security policies and that you are a financial professional.

Access will be granted immediately, but the registration process may take up to 5 business days to complete.

Thank you for registering

You can now enjoy all financial professional content.

If your download does not start automatically, click here.

An error occurred

Please check back later.

MARKET VOLATILITY

Uncertainty requires caution

04/29/2025

Thrivent Asset Management contributors to this report: Steve Lowe, CFA, chief investment strategist and John Liegl, CFA, investment product manager


Key points

Uncertainty is likely to persist

From tariff levels to fiscal policy to geopolitics, the short-term market environment is hard to predict.

Tariff levels have risen sharply

Tariffs function as a tax on imports, rising prices and likely dampening economic growth.

Stay invested

While market volatility is likely to remain high, we continue to recommend taking a longer-term investment view.


The new era of uncertainty

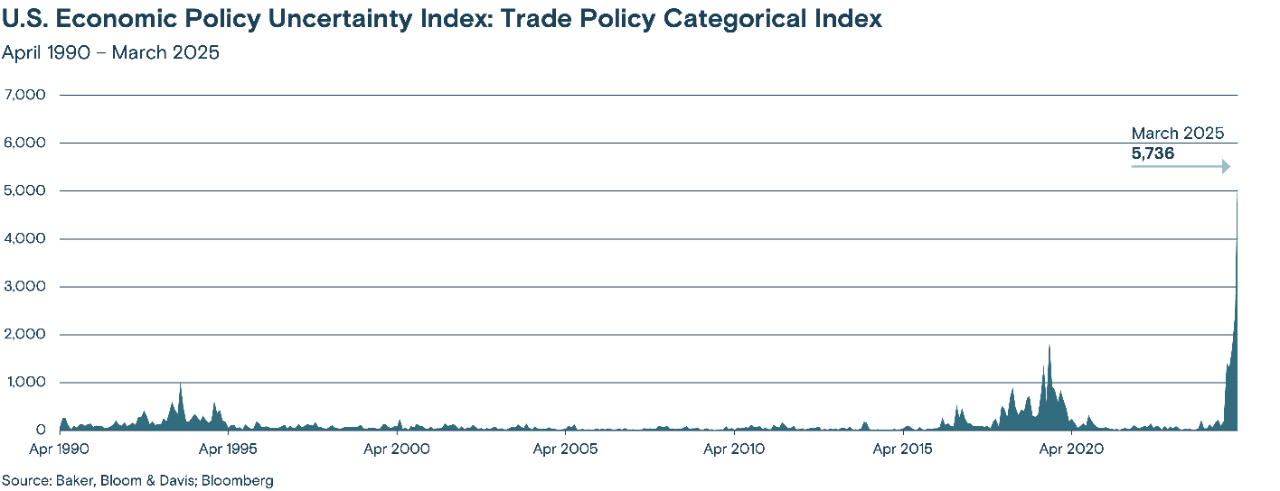
Uncertainty over rapidly evolving U.S. trade policy and the repercussions for economic growth and inflation has dominated economic news. But the unsettled outlook doesn’t stop there—U.S. Federal Reserve (Fed) independence has recently been questioned, U.S. fiscal policy remains cloudy, geopolitics is seeing a fundamental restructuring of U.S.-foreign relationships and global investors are questioning their outlook for the world’s “reserve” currency, the U.S. dollar, as tariffs rise along with sanctions.

Line chart showing the U.S. Economic Policy Uncertainty Index for Trade Policy from April 1990 to March 2025, highlighting a recent spike in uncertainty.

The fog of uncertainty and scope of volatility could expand further. The U.S. military has been more active in the Middle East and negotiations with Iran have begun over the country’s nuclear capabilities, while domestic uncertainty over policy and the economy has climbed with the jobs cuts by the Department of Government Efficiency (DOGE), a growing number of lawsuits between the private sector and the government, concerns about judicial independence and efforts to stem immigration. In short, there’s a lot going on.

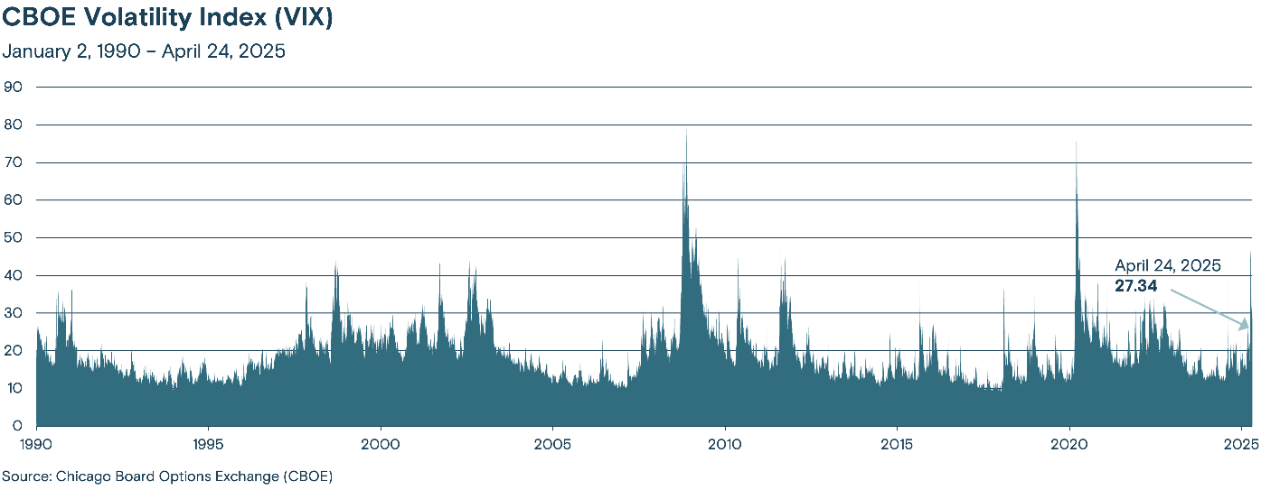
It’s important to recognize that volatility cuts both ways. There have been large one-day drawdowns only to reverse just as violently to the upside the next day. Increasingly, it is policy statements—not economic data releases—which have determined whether U.S. stocks have a good or bad day. We expect continued heightened policy uncertainty, and thus volatility, to persist in the months and quarters ahead at levels that are consistently higher than investors are accustomed to.

As the chart below shows, the upheaval from COVID-19 ushered in an extended period of growth and inflation uncertainty, sparking relatively greater volatility than in the previous decade. It seems more likely than not this volatility will persist, requiring some adjustment in the way investors approach their portfolios.

Line chart showing the CBOE Volatility Index (VIX) from January 1990 to April 2025, indicating market volatility over time.

Where does tariff uncertainty end?

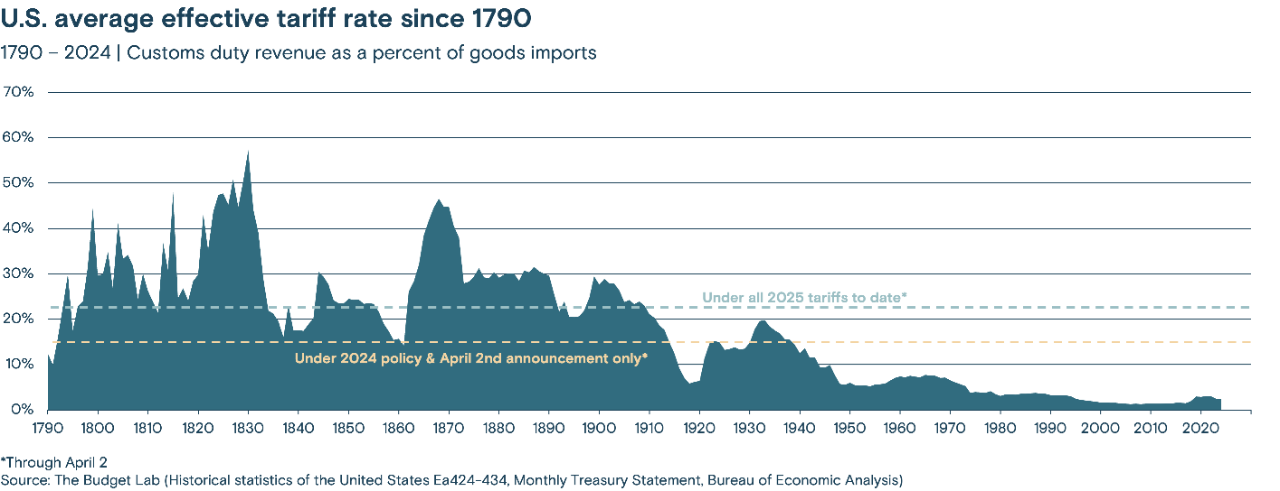
Negotiations with trading partners over tariffs and other terms of trade are underway, but we expect it will take time to hammer out terms acceptable to both sides. In the meantime, the current levels of tariffs—the highest since at least the Great Depression—are likely to impact growth and inflation.

Line chart showing the U.S. average effective tariff rate (customs duty revenue as a percentage of goods imports) from 1790 to 2024, with projections for 2025 tariffs.
Tariffs are here to stay

Higher tariffs are likely to be a fact of economic life, at levels high enough to put both downward pressure on economic growth and upward pressure on inflation. The U.S. administration believes the terms of trade have been unbalanced, and that tariffs are a key tool to reorder trade. U.S. tariffs on imports generally are lower than those of trading partners.

The use of tariffs and other tools are intended in part to onshore more production of goods in the U.S. In particular, the administration believes it can rebuild manufacturing jobs in the U.S., which have fallen roughly 35% from peak levels in the late 1970s1. As imports have risen, core inflation has fallen over the past 30 years, outside of the COVID-19 surge. That’s the tradeoff that the U.S. essentially made—more imports and less manufacturing jobs for lower prices. 

While market volatility has prompted the administration to delay or lower tariff levels, we expect the White House will persist until satisfactory deals are reached—deals which likely will include higher tariffs than the economy has seen in decades.

Slowing economic growth…

Because of the direct and indirect impact from tariffs, the International Monetary Fund (IMF) in April lowered its growth forecast for the U.S. in 2025 to 1.8% from 2.7%. The 0.9% decline in growth is less than consensus expectations, which is probably closer to a 1.5% decline (estimates vary widely and are highly dependent on the level at which tariffs stabilize). But it is not just the U.S. that will slow under higher tariffs. The IMF cut its forecast for global trade growth almost in half, from 3.8% last year to 1.7% this year, and cut its estimate for 2025 global economic growth from 3.3% to 2.8%, the slowest growth rate since 2020 (when the pandemic shocked global trade), and the second-worst global growth rate since the 2008 financial crisis.

If the good news is that forecasted annual growth rates generally are still positive (keeping in mind that a recession requires two consecutive quarters of negative growth), a key concern is that growth can rapidly decelerate. Slower growth can beget slower growth, as one company’s cutbacks impact other companies, which then cut back and so on. While growth in the first quarter has shown signs of weakness, it has also shown signs of strength, particularly in employment.

Consumer and business confidence has fallen as a result of high uncertainty. Consumers, however, so far have kept spending, as how consumers feel and what they do can vary.  The labor market remains solid, which creates income for people to spend. Whether this holds up if prices start rising is a key question.

More concerning is the fall in company confidence, and in particular confidence of CEOs. Again, the key issue is uncertainty as the policy backdrop keeps shifting, sometimes within a day. It’s hard for a CEO to plan ahead and make investments in this environment. On recent earnings conference calls, companies have been tepid about their outlook, the most since the Global Financial Crisis.

If a lack of consumer confidence eventually results in a sharp decline in consumption, or dwindling business confidence begins to affect the labor market, then we could be increasingly closer to an economic tipping point.
 

…And raising the risk of higher inflation

Tariffs likely will push up prices, but we do not expect it will be large enough or last long enough to push inflation into a vicious cycle, such as seen in the inflation-ridden 1970s and early 1980s. However, like economic growth, inflation can turn rapidly, threatening a trend toward higher rates, particularly if expectations for future inflation become embedded. On the other hand, if the uncertainty around tariffs subsides, and both consumers and businesses can plan around a short-term bump in prices, the inflationary impact from tariffs could ultimately prove temporary. 
 

The Fed will wait for clarity

Recent comments from Fed Chairman Jerome Powell have indicated the Fed has little additional clarity and conviction about the path of growth and inflation than the market does. As such, the Fed is likely to neither raise nor lower interest rates until the economic and inflation data forces its hand. Our view remains that the Fed is more likely to cut rather than hike rates on the assumption that tariffs are likely to put temporary pressure on inflation, and a slowing economy would benefit from lower rates with little risk of overheating.

Market perspectives delivered direct to your inbox

Subscribe to timely and relevant news, information, and trends on the topics that interest you most.

The weight of foreign confidence

The U.S. economy has long benefited from a central position in the global financial order. The U.S. Treasury, backed by a perception of institutional stability (including a strong and independent Fed), has issued the most stable “risk free” bonds in the world, while the U.S. dollar has long acted as the world’s reserve currency. As a result, both are cornerstones of global economic stability, with Treasury yields providing a benchmark for the world’s interest rates, and the U.S. dollar seen as the favored currency for investment and savings. To the extent these cornerstones show cracks, more volatility could lie ahead.

And in recent weeks, perceptions have shifted. Gold prices have surged around 30% this year as more of the world’s central banks have decided to diversify their reserve holdings, and more investors seek security from inflation while pivoting away from the U.S. dollar given heightened policy uncertainty in the world’s largest economy.

While some commentators have suggested a psychological threshold has been reached, even breached, we believe it is too early to anticipate a significant disruption in the global financial order and an ongoing and substantial pivot away from U.S. markets. However, uncertainty is high, which amplifies the range of possible outcomes and the corresponding risks. As the U.S. is the world’s largest borrower, with a debt-to-gross domestic product (GDP) ratio near 120% and more than $36 trillion of debt outstanding, sustained demand is important to keep borrowing costs low. But, after the sweeping tariffs announced on April 2 (Liberation Day), the U.S. Treasury market showed signs of stress.

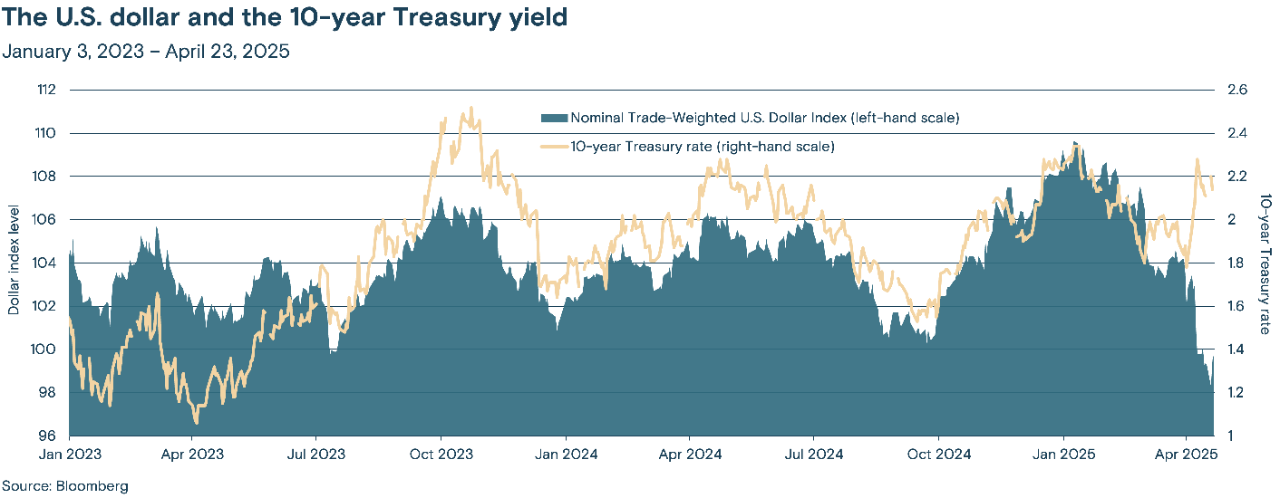
The figure below shows the relationship between the U.S. dollar and the 10-year Treasury bond’s real yield (the yield after accounting for inflation). While the two have tended to move in concert, that changed on April 2. The U.S. dollar plummeted despite higher U.S. interest rates, and bond yields saw their largest weekly rise in a quarter of a century. Tellingly, U.S. Treasury credit default swaps—financial instruments that measure the perceived default risk of a bond—rose, although the imputed odds of default remained very low.

Line chart showing the Nominal Trade-Weighted U.S. Dollar Index and the 10-year Treasury rate from January 2023 to April 2025. The dollar index is shown on the left axis, and the treasury rate on the right.

These sharp and chaotic Treasury moves helped trigger the 90-day pause for the bulk of the tariffs announced on April 9. As such, we have confidence that the administration understands that markets can tolerate only so much uncertainty. While the White House has acknowledged economic growth may slow to accomplish its trade objectives, we are confident that significant market disruptions would result in course corrections, even if only to give the market time to better assess the risks.

Positioning in the current environment

After a decade of concern about inflation and interest rates being too low, the shock of COVID-19 reminded global investors that inflation was not only possible but could see a massive surge (to nearly double digits) with the right shock to the global economy. In our view, the last few months have reminded investors that they cannot take the status quo in trade or geopolitical relations for granted. Regardless of the expected risks to the U.S. economy, stocks, bonds or the U.S. dollar, investors should anticipate higher volatility as a byproduct of the uncertainty around those expectations.

While a great deal of uncertainty lies ahead, investors can take some comfort in remembering that volatility doesn’t just mean stocks or bonds can rapidly lose value, but that they can also see just as rapid recoveries. On April 9, after the announcement of a 90-day pause on the bulk of tariffs revealed on April 2, the S&P 500® Index rose 9.4%—one of its largest one-day rallies in the last century.

As the figure below shows, missing out on the best 10 single days in the S&P 500 Index from 2010 to 2024 would have resulted in roughly half the total return earned by staying invested over the entire period.

Horizontal bar chart comparing the growth of a $10,000 investment in the S&P 500 from 2010-2024, showing the impact of missing the best trading days. Staying invested the entire time yields significantly higher returns.

While short-term volatility has been and could remain severe, the period illustrated above includes such high volatility periods as the onset of COVID-19, surging inflation, Russia’s invasion of Ukraine, conflict in the Middle East, the U.K. exiting the European Union and countless other surprises. Throughout this period and despite all these events, the U.S. economy adapted and thrived overall.

We have little doubt that when the current period of uncertainty quiets down, the U.S. economy—bolstered by its dynamism and diversity—will adapt and thrive. In the meantime, we continue to take comfort in an otherwise healthy economy, largely free of alarming imbalances, such as extreme corporate or consumer leverage. Furthermore, we continue to expect productivity to benefit from increasingly more powerful artificial intelligence, while the potential for more business-friendly policies remains a possible tailwind when the administration turns its attention to regulation and taxes. 

While the odds of a recession have clearly risen meaningfully, our base case remains that growth will slow but avoid a recession as the economy entered this period of volatility in solid shape.

As such, we continue to recommend that investors who can tolerate volatility or have relatively low need for liquidity to stay invested. And we continue to recommend favoring higher-quality assets in both stocks and bonds, while accepting that Treasuries may not provide as much diversification as we have come to expect. As such, even a balanced portfolio could be relatively volatile, making cautious allocations more important. For those investors who have higher liquidity needs, we recommend a more contrarian approach, seeking to reduce exposure on strength, to better preserve capital and returns.

For all investors, we recommend a reassessment of investment goals, tolerance for volatility and investment thesis. Our investment strategy is predicated on both a long-term horizon and our conviction that, over the long-term, economic fundamentals drive market returns.


Media contact: Callie Briese, 612-844-7340; callie.briese@thrivent.com

All information and representations herein are as of 04/30/2025, unless otherwise noted.

The views expressed are as of the date given, may change as market or other conditions change, and may differ from views expressed by other Thrivent Asset Management, LLC associates. Actual investment decisions made by Thrivent Asset Management, LLC will not necessarily reflect the views expressed. This information should not be considered investment advice or a recommendation of any particular security, strategy or product. Investment decisions should always be made based on an investor's specific financial needs, objectives, goals, time horizon, and risk tolerance.

Past performance is not necessarily indicative of future results.

Any indexes shown are unmanaged and do not reflect the typical costs of investing. Investors cannot invest directly in an index.

The U.S. Economic Policy Uncertainty Index: Trade Policy Categorical Index is a sub-index based solely on news data. It is derived using results from the Access World News database of more than 2,000 newspapers. The index requires economic, uncertainty and policy terms as well as a set of categorical policy terms.

The CBOE Volatility Index® (VIX®) is a key measure of market expectations of near-term volatility conveyed by S&P 500 stock index option prices. VIX is the ticker symbol for the Chicago Board Options Exchange (CBOE) Volatility Index, which shows the market’s expectation of 30-day volatility.

The Nominal Trade-weighted U.S. Dollar Index measures the value of the U.S. dollar based on its competitiveness versus trading partners.

The S&P 500® Index is a market-cap weighted index that represents the average performance of a group of 500 large-capitalization stocks.

Federal Reserve Bank of St. Louis. https://fred.stlouisfed.org/series/manemp. April 28, 2025.